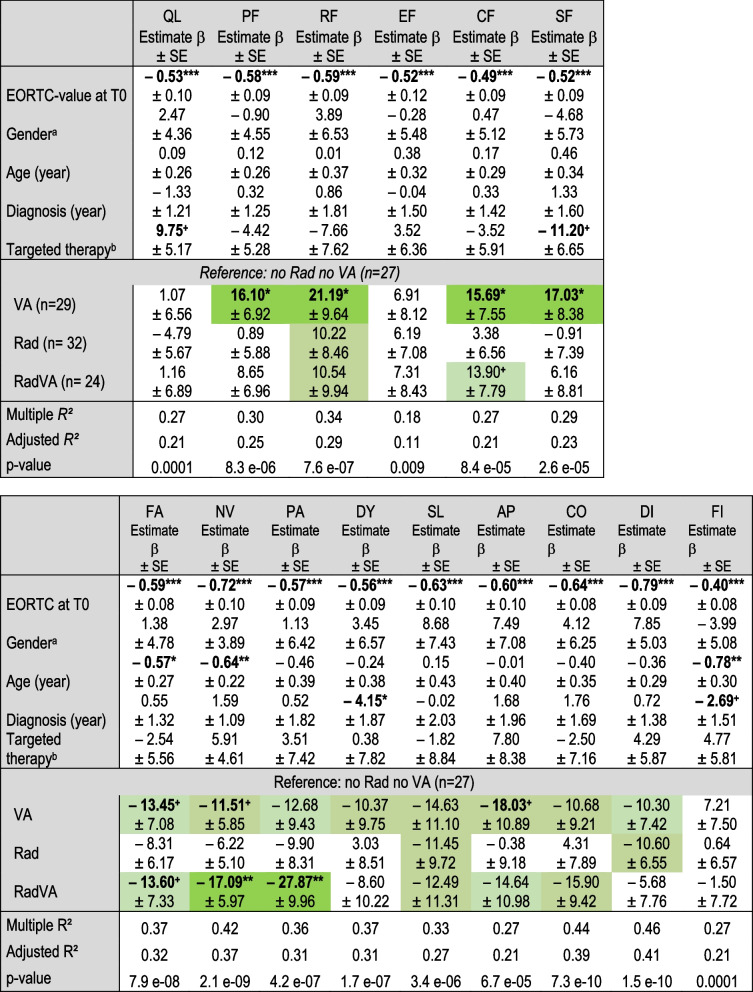
Table 4.
Association factors for EORTC QLQ-C30 changes
Multivariate linear regression analyses were performed for EORTC QLQ-C30 scale changes (T0– > T1). Improvements of functional scales are indicated by positive whereas symptoms by negative estimates. Improvements > 10 are highlighted in green
Significant p-values are indicated: ***p-value < 0.001; **p-value < 0.01;*p-value < 0.05; +p-value < 0.1
aReference: male
bReference: no targeted therapy
SE standard error; QL global health status; functional scales: PF physical; RF role; EF emotional; CF cognitive; SF social; symptoms: FA fatigue; NV nausea/vomiting; PA pain; DY dyspnea; SL insomnia; AP appetite loss; CO constipation; DI diarrhea; FI financial difficulties

