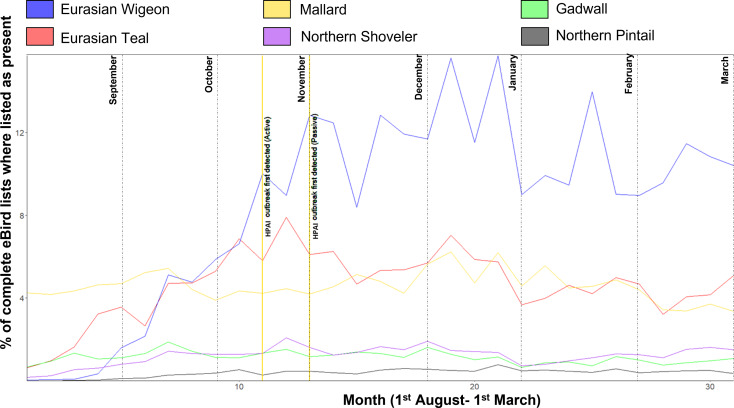
Fig. 4.
Relative abundance (% of complete ebird species presence checklists where present per week) of migratory dabbling ducks in the UK from the 1 August 2020 to 1 March 2021 constructed from Ebird abundance data [29]. First detection dates for both passive and active methods are shown and labelled in vertical yellow lines. Month lines signify the week that included the first day of the month.

