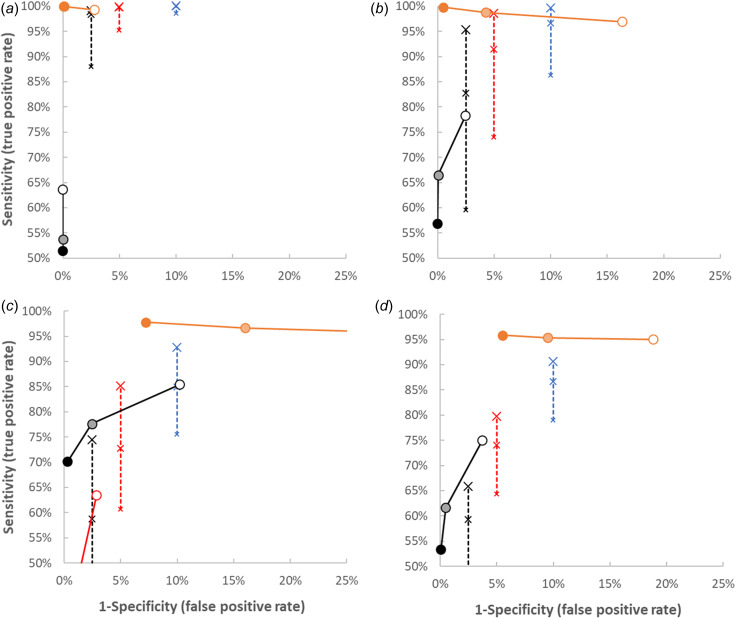
Fig. 4.
Simulated sensitivity and specificity of potential signals in the scenario with fourfold increase of the number of shedders and two sets of k = 6 samples with σfaeces = 0.5 (a), σfaeces = 1 (b), σfaeces = 1.5 (c), sPCR = 0.3 (d) and other values as in the baseline. Only results with sensitivity >50% and specificity >75% are shown. Symbols and lines are identical to those in Figure 3.

