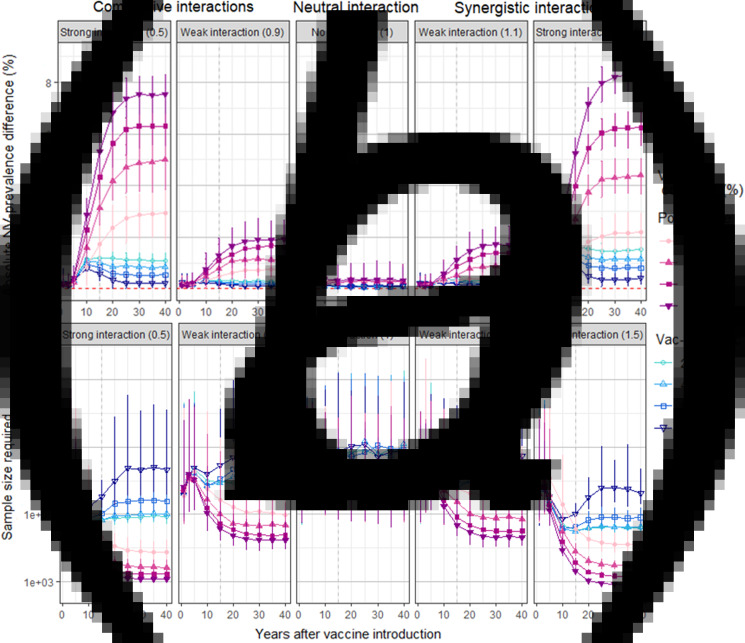
Fig. 5.
Absolute prevalence-difference values for NV genotypes (a) and corresponding sample sizes (b) over time according to strength of competitive, neutral and synergistic interactions (γ), epidemiological study design (post-vs.-pre or vaccinated-vs.-unvaccinated) and vaccine coverage. Dashed vertical lines at 15 years indicate when all age cohorts have been offered the vaccine. Median values and 90% empirical intervals over 100 simulations are shown. For synergistic values, prevalence differences are negative; they are presented here as absolute values for ease of comparability.

