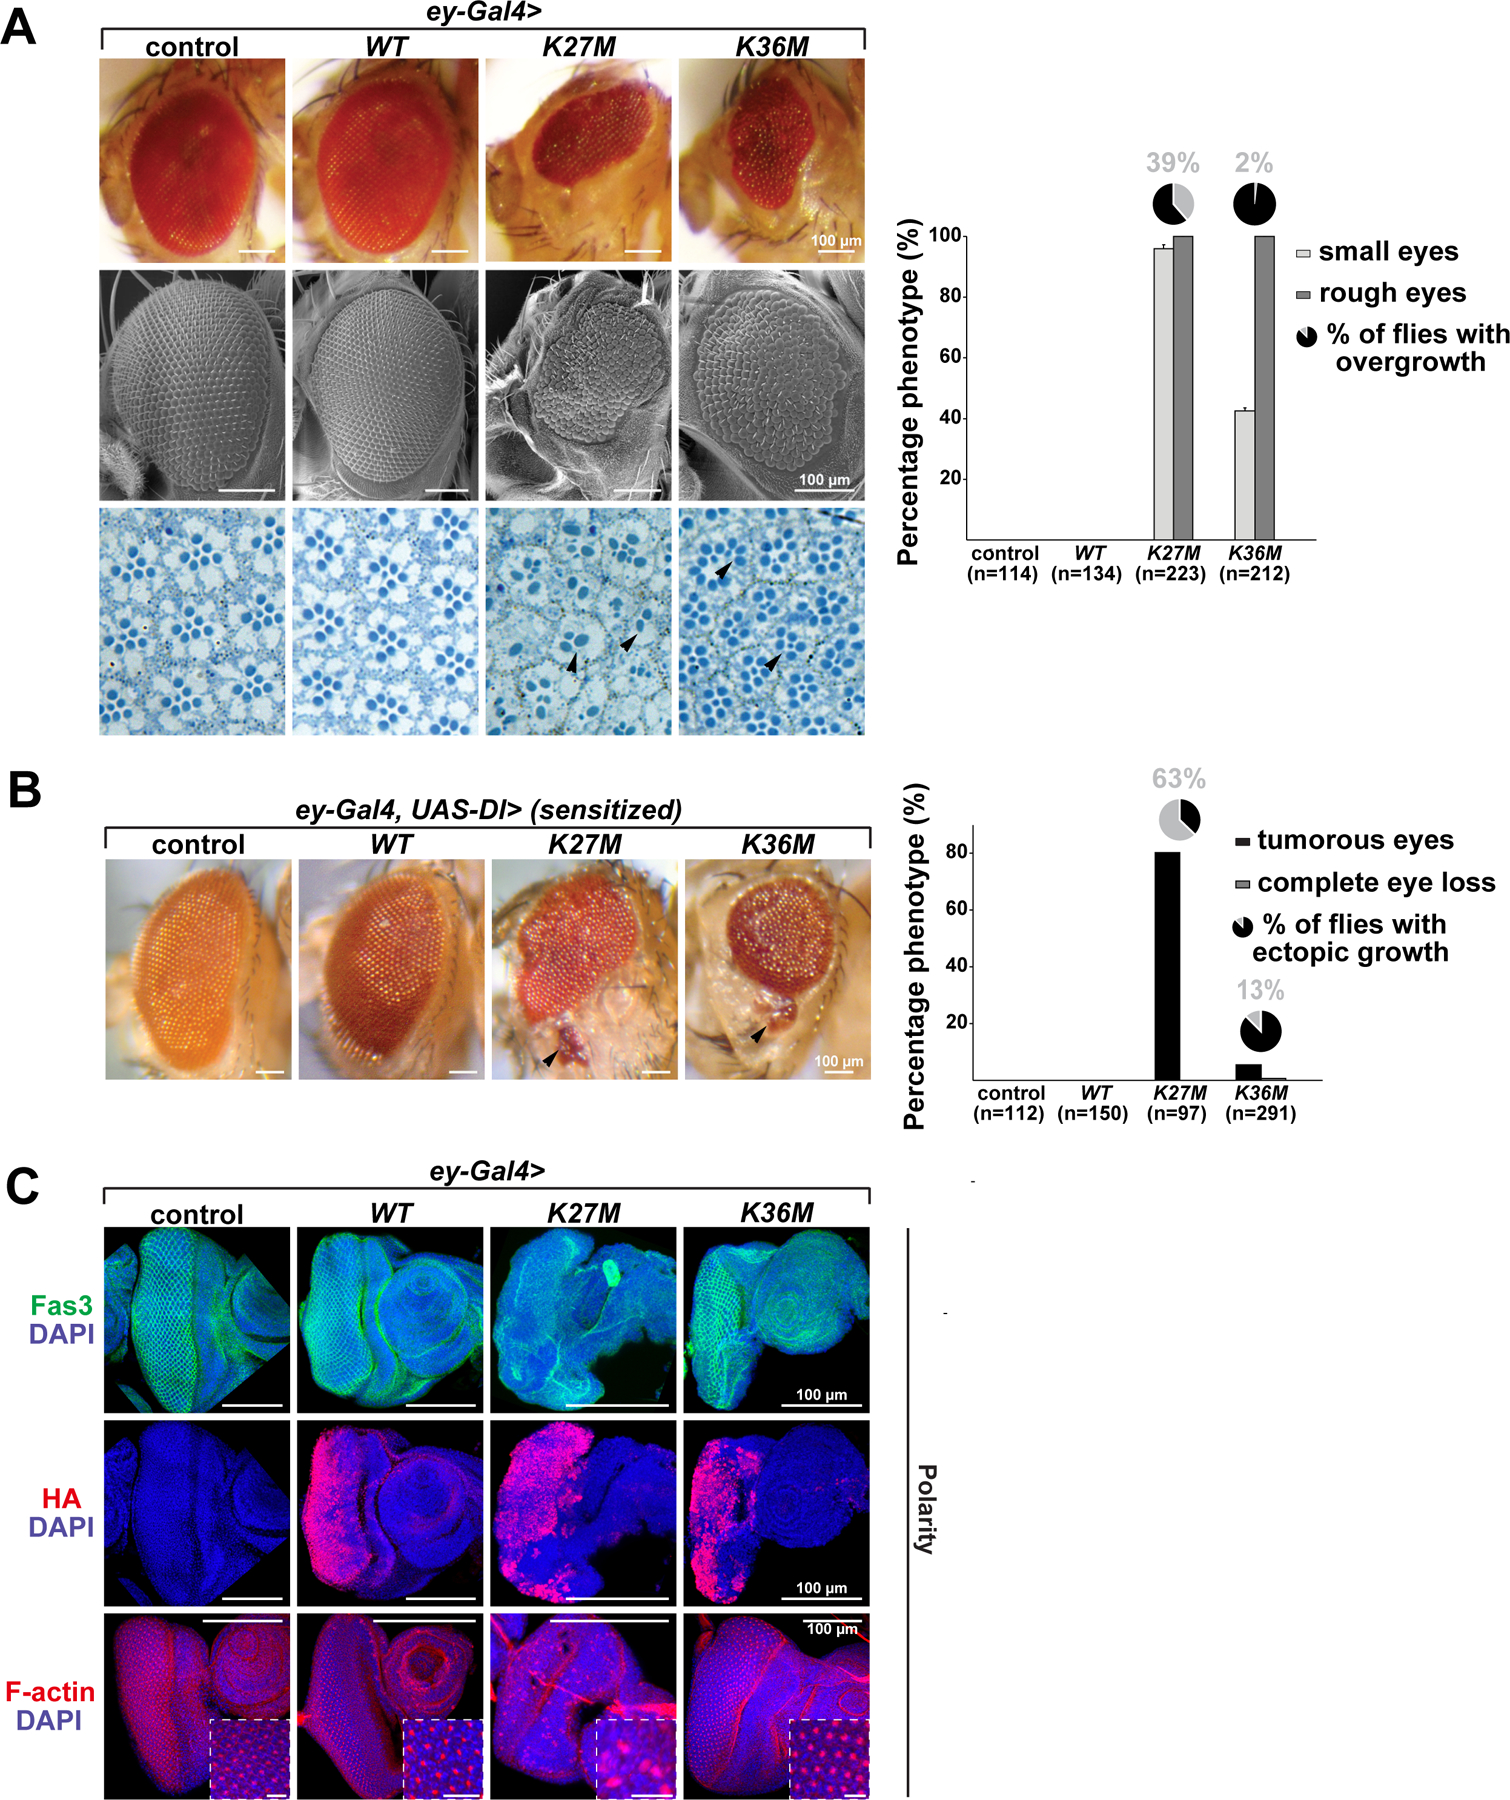
Fig. 1. Overexpression of H3.3K27M and H3.3K36M in eye imaginal discs using ey-Gal4 produces hypotrophic and tumorous eyes.

(A) Expression of H3.3K27M and H3.3K36M induces small eyes (upper panel), disorganization of ommatidia (rough eye phenotype), in some cases overgrowth, and decreased photoreceptor neurons (lower panel, black arrowheads) while expression of H3.3 wild-type (WT), and a Gal4 control have no effect on eye size and architecture; quantifications for the eye phenotypes are depicted in the right panel. Light grey bars represent percentage of small eyes, dark grey bars represent percentage of rough eyes, and pie charts percentage of flies with overgrowth phenotype; (n) represents total number of flies counted. (B) Sensitized flies overexpressing the Notch ligand Delta (Dl) in the developing eye display increased eye size. Tumorous eyes with metastasis of eye tissue (black arrowheads) are obtained upon expression of H3.3K27M and to much lower extent of H3.3K36M. Black bars represent percentage of tumorous eyes, grey bars represent percentage of flies with complete eye loss, and pie charts metastasis incidence within the tumorous eye phenotypes; (n) represents total number of flies counted. (C) Immunofluorescence staining for Fasciclin III, HA and the polarity marker F-actin in Gal4 control, H3.3 WT, H3.3K27M and H3.3K36M overexpressing eye imaginal discs. Transgene expression is visualized by HA staining. Areas in squares are shown at higher magnification. Scale bar 10µm. See also Fig. S1.
