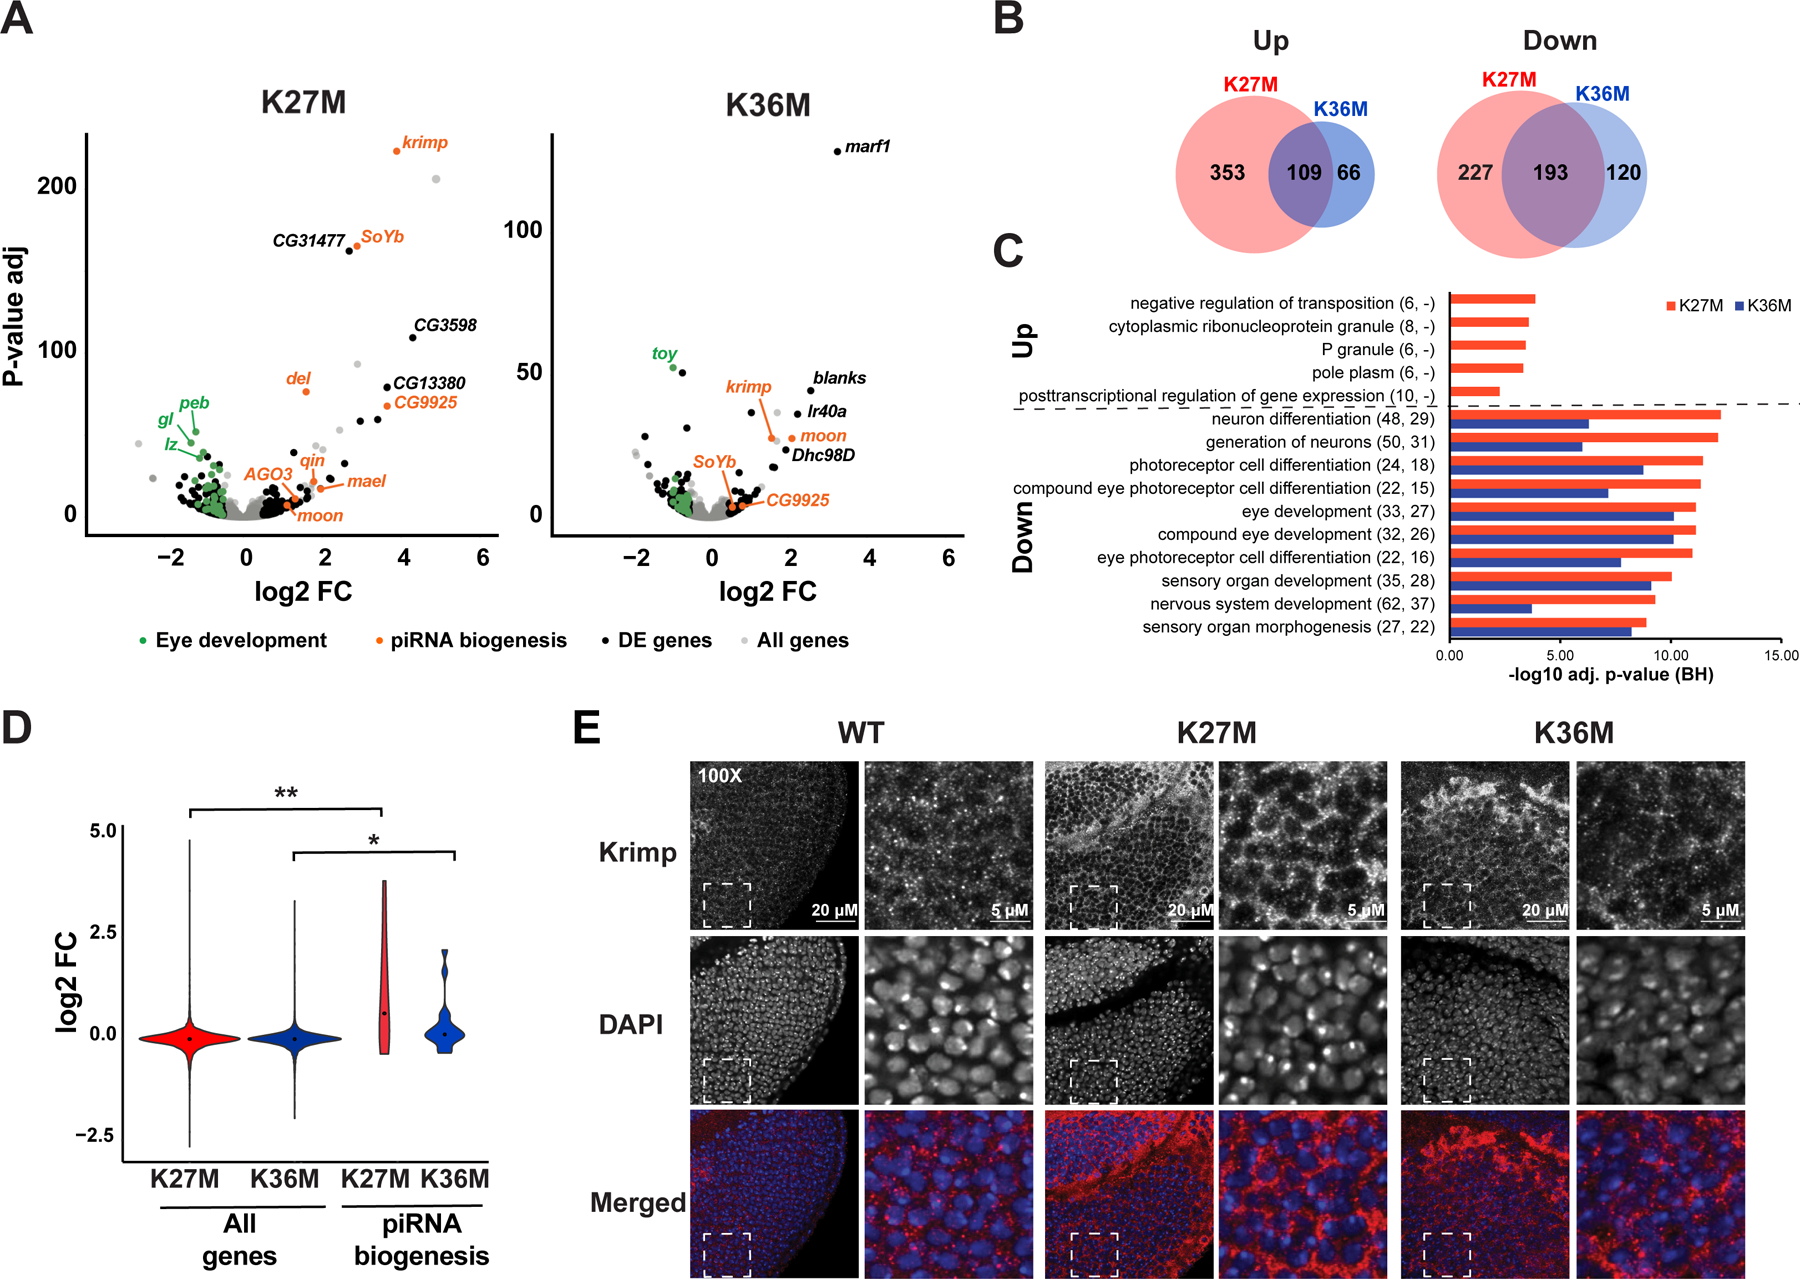
Fig. 3. H3.3K27M or H3.3K36M expression results in downregulation of genes involved in eye development and upregulation of the piwi-interacting RNA (piRNA) pathway.

(A) Differential gene expression analysis of H3.3K27M (left) or H3.3K36M (right) compared to yw baseline control. Grey: all genes. Black: significantly deregulated genes (adjusted p-value < 0.05, absolute log2 fold change > 0.5, mean expression > 100) not affected when overexpressing H3.3 WT. Orange: piRNA pathway genes. Green: genes involved in eye development. (B) Overlap of statistically significant genes associated with expression of each H3.3 mutant. (C) Gene ontology analysis of top enriched biological processes in differentially expressed genes, as in (A). Numbers in parentheses indicate number of differentially expressed genes observed under each category in H3.3K27M and H3.3K36M mutant respectively. (D) piRNA biogenesis genes show significant increase in expression upon H3.3K27M expression. (E) Right: immunofluorescent staining (red in merged) for Krimp in ey>H3.3 WT, ey>H3.3K27M, and ey>H3.3K36M eye discs. The DNA stain DAPI (blue in merged) is used as an exposure control. White dashed square indicates field sampled for inset. Left: inset images showing cytoplasmic distribution of Krimp. See also Fig. S3, Table S1–S4.
