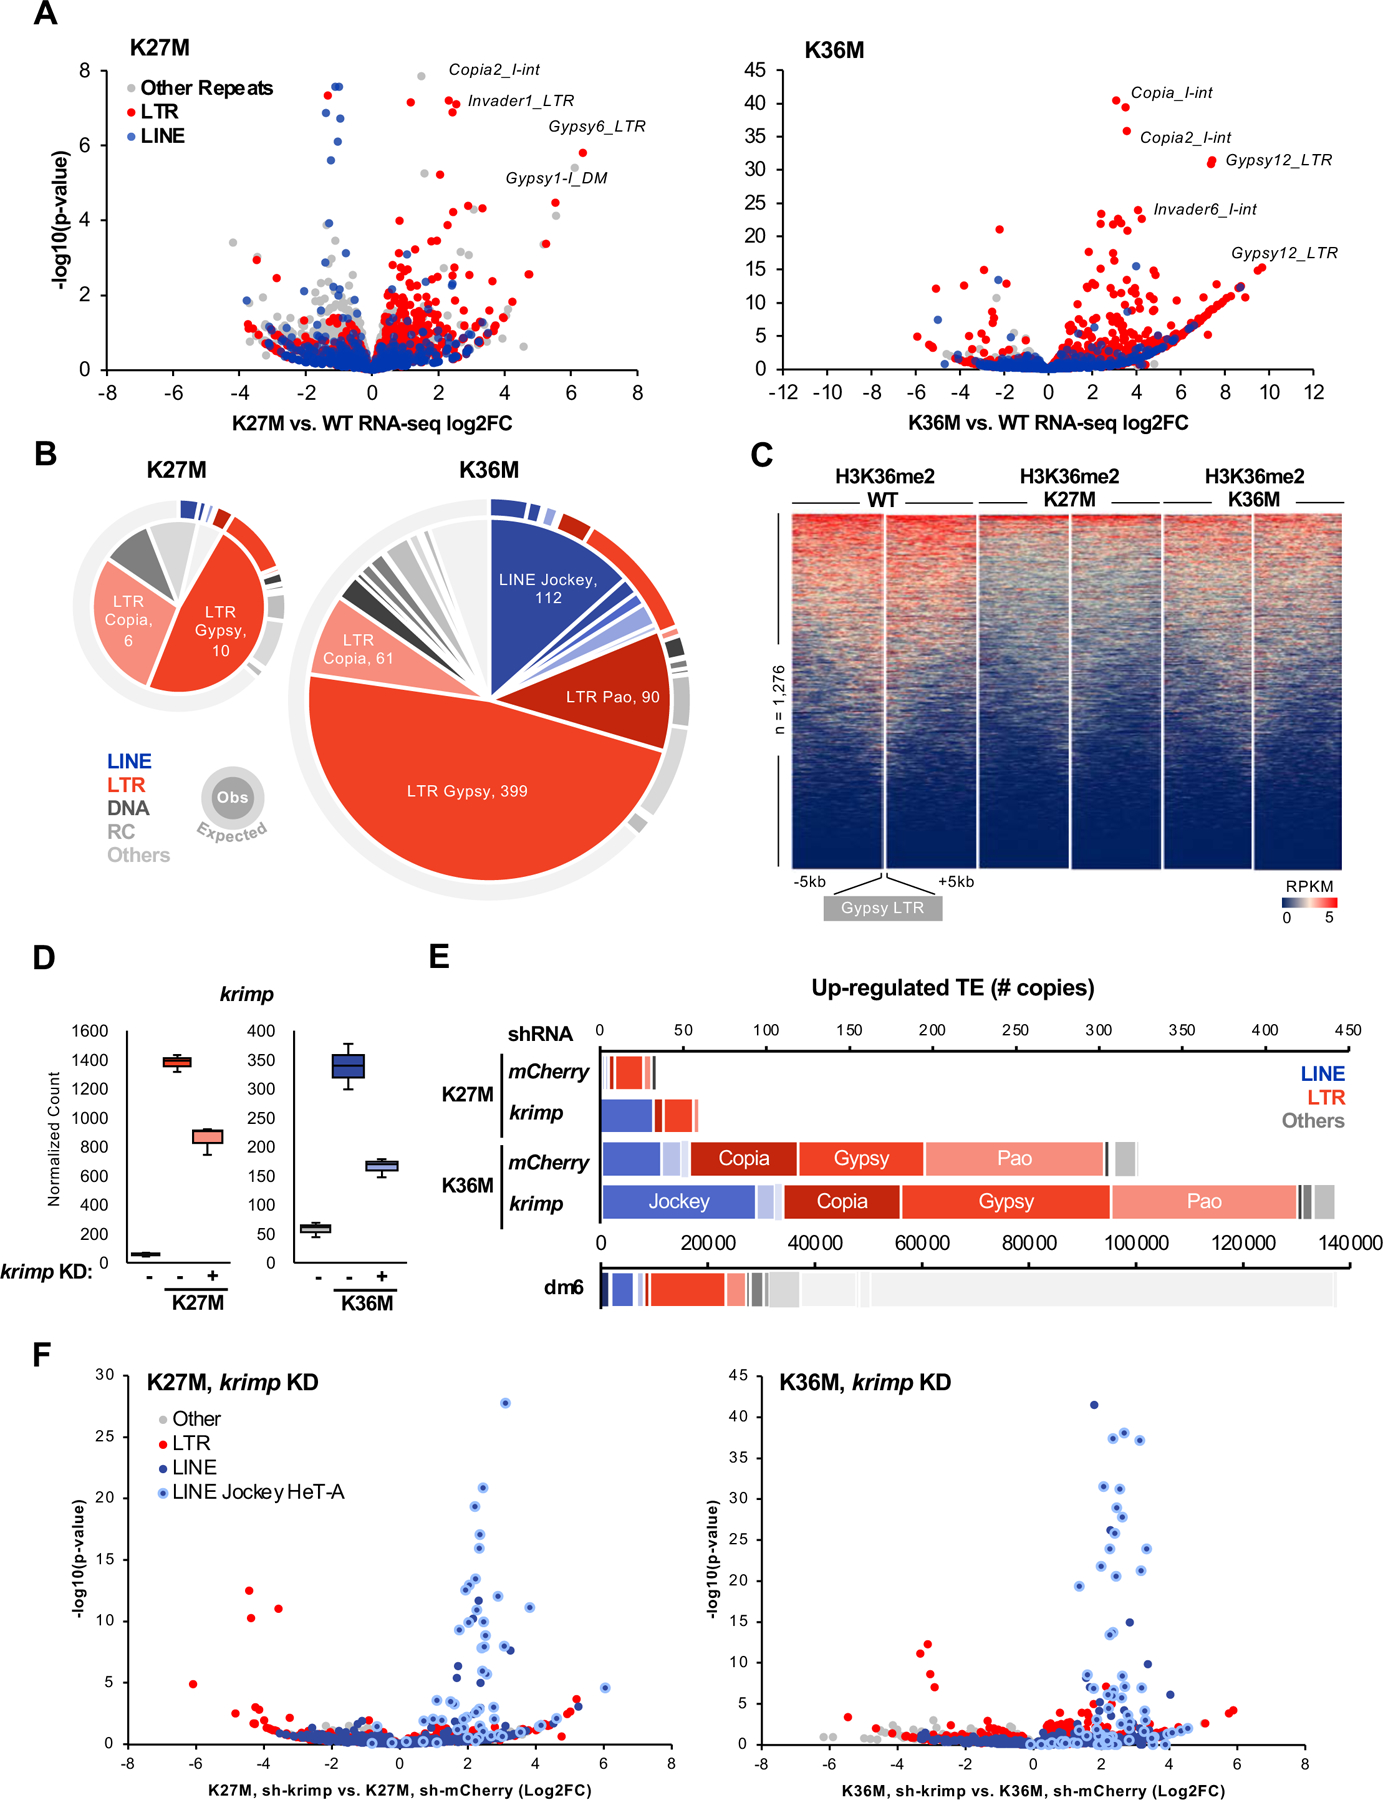
Fig. 5. H3.3K27M and K36M de-repress transposable elements in flies.

(A) Volcano plot depicting K27M- (left) and K36M-mediated transcrional dysregulation in repetitive sequences. Each dot represents an individual copy of repeat, red dots represent individual LTR elements while blue dots depict LINEs, grey dots represent all other repetitive classes. Note that K36M de-represses LTR repeats to a greater extent than K27M. (B) Pie chart representing the number of significantly up-regulated (log2FC > 2, FDR < 0.05) elements in each repeat class in H3.3K27M and H3.3K36M eye discs. Outer ring depicts copy number of each repeat class in Drosophila melanogaster genome dm6. (C) Stacked heatmap depicting H3K36me2 enrichment at all gypsy LTR (n = 1,276) in H3.3 WT, H3.3K27M, and H3.3K36M flies. (D) RNA-seq normalized count for krimp knockdown validation in H3.3K27M and H3.3K36M flies. Negative sign (-) indicate mCherry RNAi. (E) Number of transposon elements significantly up-regulated (log2FC > 0, FDR < 0.05) in krimp KD K27M and K36M, compared to mCherry RNAi negative control. Below, copy number of each repeat class in dm6. (F) Volcano plot depicting repeat sequence dysregulation upon krimp KD, compared to mCherry KD control, in H3.3K27M and H3.3K36M flies. Each dot represents an individual copy of repeat, red dots represent individual LTR elements, blue dots depict LINEs (light blue circle: Jockey HeT-A family), grey dots represent all other repetitive classes. See also Fig. S6, Table S5.
