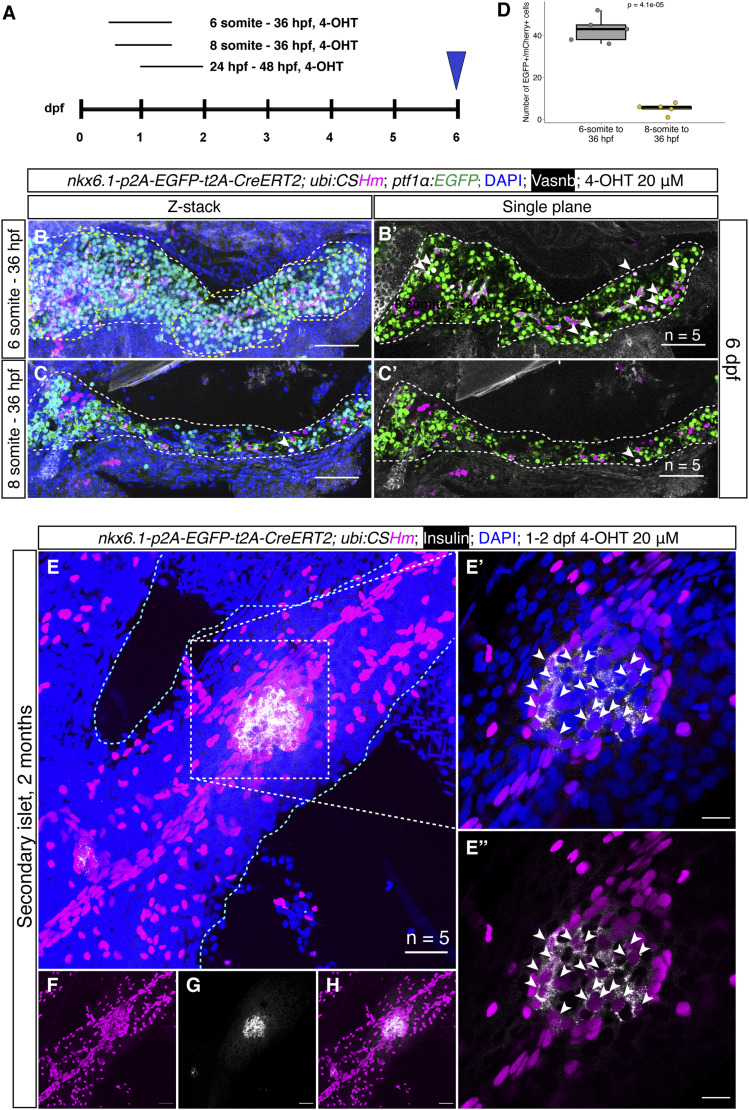
Figure 3. nkx6.1+ cells were gradually restricted to the duct and gave rise to secondary islets in the zebrafish pancreas.
(A) Experimental timeline for temporal labelling using short-term and long-term lineage tracing. 4-OHT (20 μM) was added at the 6 or 8 somite stage and the treatment continued until 36 hpf for short-term lineage tracing. (B, C, E, F, G, H) (B, B’, C, C’) 4-OHT (20 μM) was added from 1–2 dpf and confocal imaging was performed at 60 dpf for the long-term lineage tracing (E, F, G, H). Representative confocal images of the pancreas at 6 dpf in TgKI(nkx6.1-p2A-EGFP-t2A-CreERT2; ptf1α:EGFP);Tg(ubi:CSHm). The progenies of nkx6.1+ cells after 4-OHT treatment were H2BmCherry positive. The EGFP signals indicate acinar cells. Intrapancreatic ductal cells were demonstrated by membrane staining using the anti-Vasnb antibody (shown in white). The region within the yellow dashed line in B indicates H2BmCherry+/EGFP+ enrichment. Arrowheads in (B’, C, C’) point to H2BmCherry+/EGFP+/Vasnb− cells, both indicating acinar cells from nkx6.1+ cell origin. For each condition, we scanned five samples with 16–24 single-planes for larval pancreata and 18–30 single planes for juvenile pancreata. (B, C) The Z-stacked images were displayed (B, C) demonstrating a large number of mCherry+/EGFP+ cells with 4-OHT treatment starting from six-somite stage, whereas the number of double positive cells are decreased with statistical significance. (D) The quantification and statistical results of EGFP/mCherry double positive cells with 4-OHT treatment starting at 6 and 8 somite stages. Two-tailed t test was used for statistical analysis, with P-value < 0.05 considered as statistically significant. (E, F, G, H) Projection images of lineage-traced secondary islets in the TgKI(nkx6.1-p2A-EGFP-t2A-CreERT2);Tg(ubi:CSHm) zebrafish pancreas at 60 dpf. The progenies of nkx6.1+ cells after the 4-OHT 1–2 dpf treatment were H2BmCherry positive. (E) The selected area in the white dashed square in (E) was magnified in a single plane (E’, E’’). (E) The cyan dashed lines outline the pancreas (E). (E, F, G, H) Split channels of (E) are displayed for clarity (F, G, H). Arrowheads point to lineage-traced β-cells in the secondary islet co-stained with an anti-Insulin antibody. (B, C, E, F, G, H) Scale bars = 80 μm (B, B’, C, C’), 20 μm (E, F, G, H), or 10 μm (E’, E’’), respectively.

