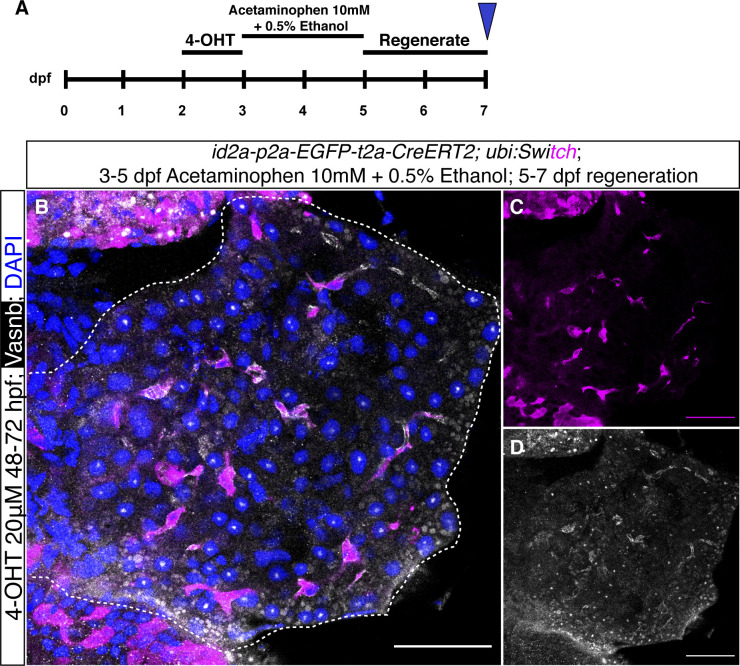
Figure S15. id2a lineage-traced cells in chemically induced liver injury model.
(A) Experimental timeline of id2a lineage-tracing in a chemically induced liver injury model. (B, C, D) Representative confocal images of id2a lineage-traced cells in severe chemically induced liver injury model, with acetaminophen 10 mM and 0.5% ethanol treatment for 2 d followed by 2 d of recovery. The white dashed lines indicate the liver. Scale bars = 40 μm.

