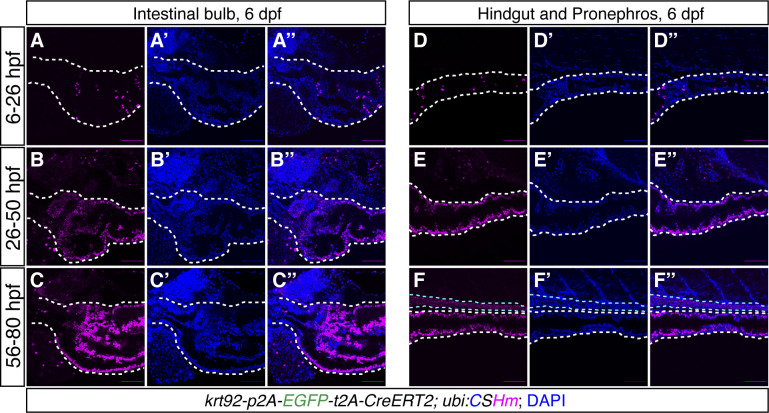
Figure S4. TgKI(krt92-p2A-EGFP-t2A-CreERT2);Tg(ubi:CSHm) zebrafish larvae with 4-OHT temporal labelling at different timepoints.
(A, B, C) Representative confocal images of zebrafish larvae at 6 dpf showing krt92 lineage-traced cells in the intestinal bulb with 4-OHT treatment from 6–26 hpf (A, A’, A’’), 26–50 hpf (B, B’, B’’) or 56–80 hpf (C, C’, C’’). The white dashed lines outline the intestinal bulb. (D, E, F) Representative confocal images of zebrafish larvae at 6 dpf showing krt92 lineage-traced cells in the hindgut and pronephros with 4-OHT treatment from 6–26 hpf (D, D’, D’’), 26–50 hpf (E, E’, E’’) or 56–80 hpf (F, F’, F’’). The white dashed lines outline the hindgut; the cyan dashed lines outline the pronephros. The signal from the fluorescent protein was enhanced by immunostaining. Scale bars = 80 μm.

