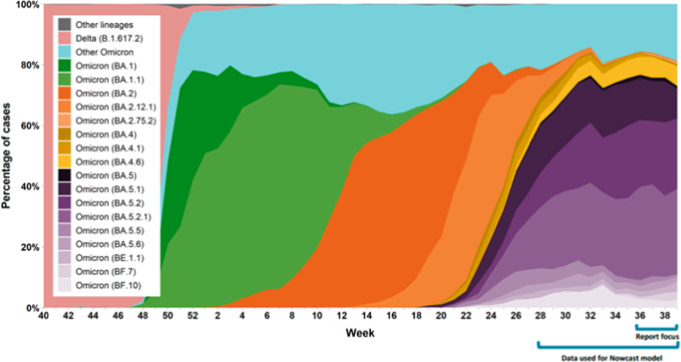
Fig. 4. Percentage of COVID-19 cases by the most prevalent lineages and week in Ontario from October 3, 2021 to October 1, 2022.
Percentage of COVID-19 cases by the most prevalent lineages and week, representative surveillance, Ontario, October 3, 2021 to October 1, 202227. Each color represents a different lineage or sublineage of Omicron. Note: results may not be representative of Ontario overall, particularly in earlier weeks. Week was assigned based on earliest date available for a sample. If more than one sample was sequenced for a case, the most recent sample was included. Results for recent weeks are incomplete as not all sequencing and bioinformatics analyses were complete at the time of data extraction. Data sources: Public Health Ontario, Hospital for Sick Children, Kingston Health Sciences Centre, Shared Hospital Laboratory, Hamilton Regional Laboratory Medicine Program.

