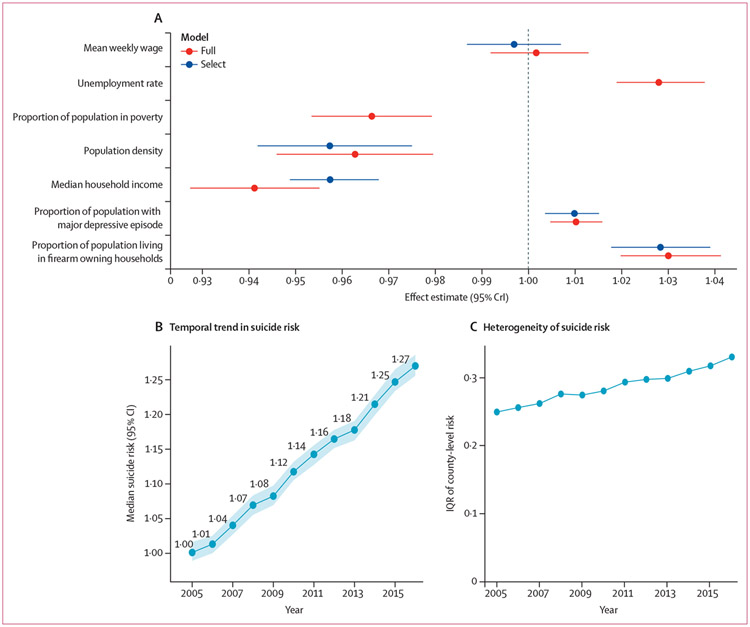
Figure 1: Effect estimates and trends in suicide risk (2005–16).
(A) Posterior median and 95% CrIs of the effect estimates from conditional autoregressive-ANOVA models, per one SD change in variable. (B) Estimates of national suicide risk; shaded area shows 95% CIs. (C) IQR of county-level risk as estimated by the select model; higher IQRs indicate greater heterogeneity and an increase in IQR with time indicates a widening gap between counties in which suicide risk is low and counties in which suicide risk is high. CrI=credible interval.

