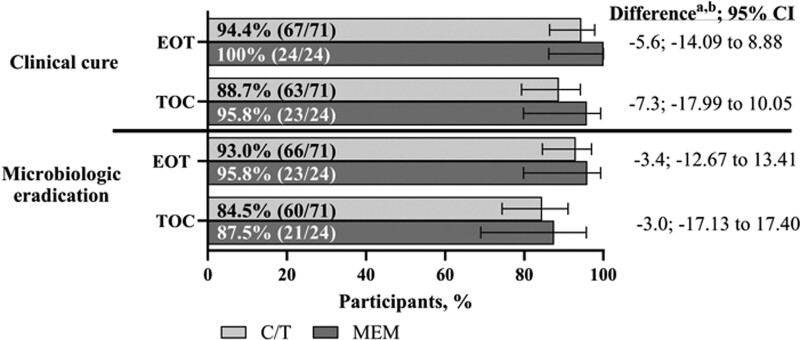
FIGURE 2.
Clinical and microbiologic response at EOT and TOC (mMITT population). aDifference in C/T minus MEM. bThe percent difference was based on the Miettinen & Nurminen method stratified by age group with Cochran-Mantel-Haenszel weights. If there was a zero count in any class of the stratum, the groups with the lower count were pooled with the near age group stratum in the model. CI indicates confidence interval; C/T‚ ceftolozane/tazobactam; MEM, meropenem; mMITT, microbiologic modified intent-to-treat population; TOC, test of cure.

