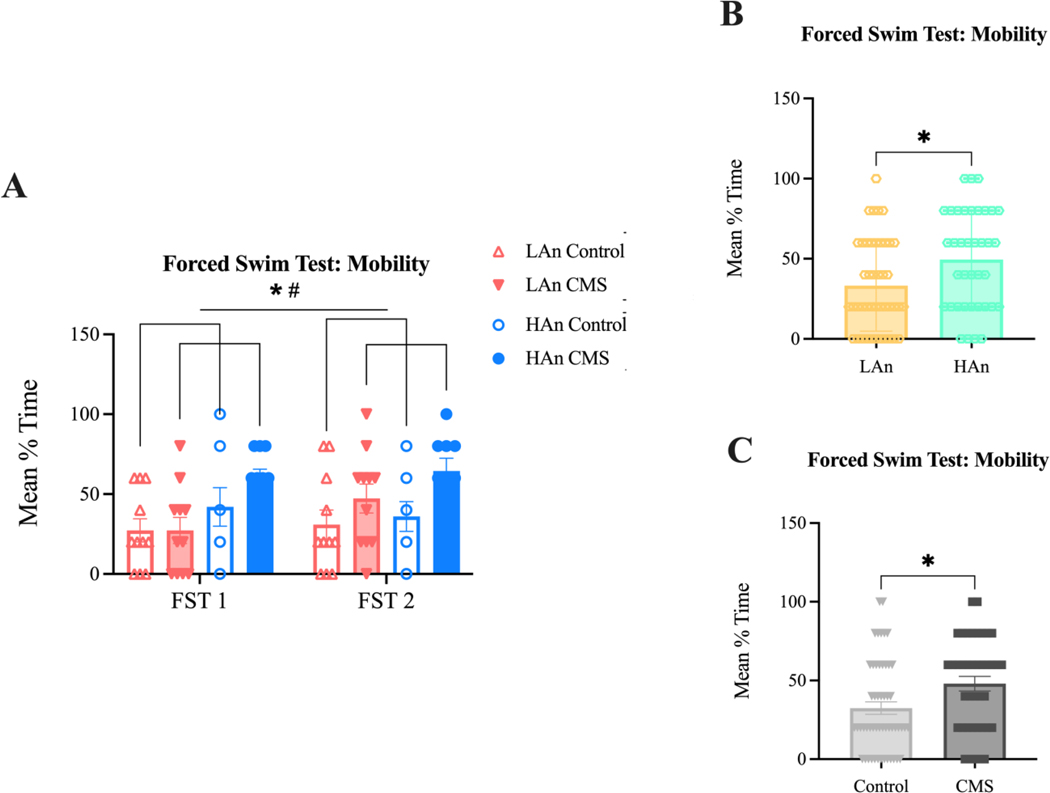
Figure 4A-C. FST Mean % Time Mobile.
Bar graphs with scatter plots (A-C). Data are represented as mean % mobility time ±SEM. (A) A three-way mixed ANOVA (N=41) revealed that CMS and control rats [F (1, 74) = 5.636; *p=0.0202] as well as HAn and LAn rats [F (1, 74) = 6.995; *p=0.0100] differed in % time spent mobile. (B-C) Two Welch’s-corrected unpaired t-tests (N=41), one collapsed across treatment and time to highlight trait differences (B) and the other collapsed across Trait and time to highlight treatment differences (C). (B) HAn rats (n=19) spent more time mobile than LAn rats (n=22) (t=2.483, df=75.92; *p=0.0152). (C) CMS animals (n=20) exhibited more mobility than control rats (n=21) (t=2.550, df=83.53; *p=0.0126).

