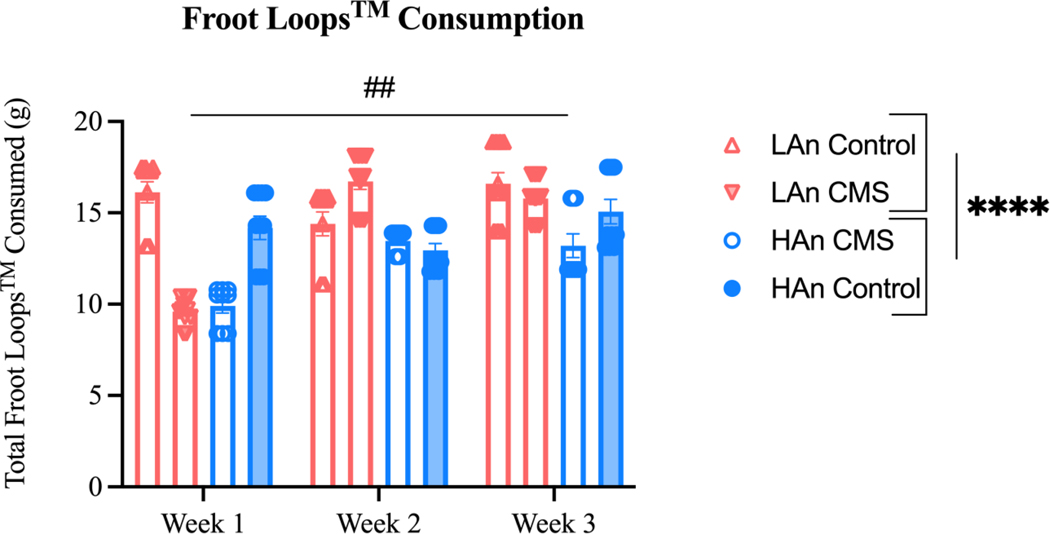
Figure 5. Froot Loops™ Consumption across CMS Treatment.
Scatter bar plots depict a three-way mixed ANOVA. Data are represented as total Froot Loops™ consumption ±SEM. A three-way mixed ANOVA (N=41) revealed HAn animals differed from LAn counterparts [F (1, 111) = 34.63; ****p<0.0001], and an interaction effect across all three factors [F (2, 111) = 4.426; ##p=0.0141].

