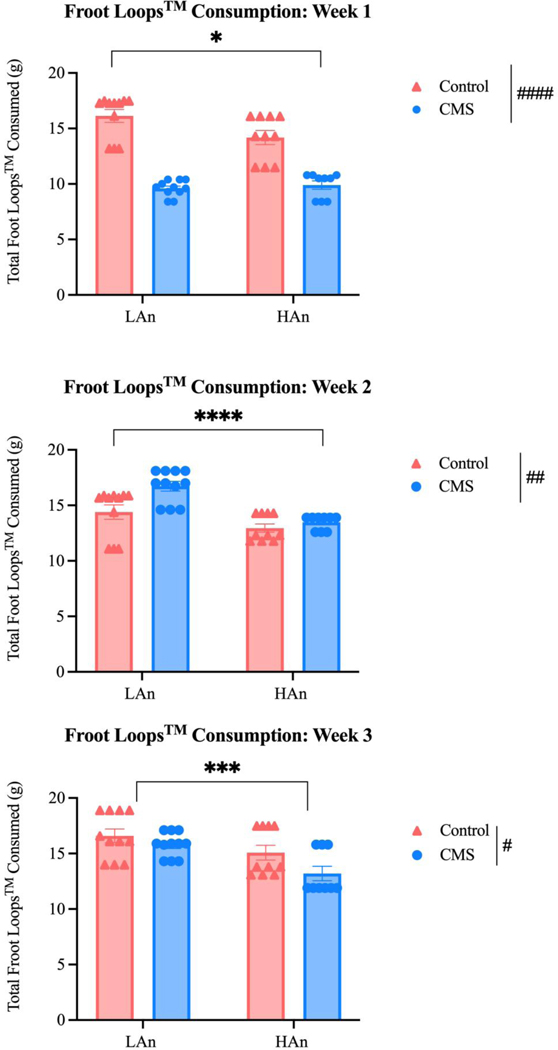
Figure 6. Froot Loops™ Consumption per CMS Week.
Scatter plots (A-C) that depict a series of two-way ANOVAs (N=41) reflecting total Froot Loops™ consumption (g) per CMS week to examine potential phenotypic differences. (A) Week one analyses revealed that HAn/LAn CMS rats consumed less Froot Loops™ than HAn/LAn control rats [F (1, 37) = 5.379; p=0.026] and consumption differed for CMS and control animals [F (1, 37) = 124.2; ####p<0.0001]. (B) One week post CMS, HAn rats consumed less Froot LoopsTM than LAn rats [F (1, 37) = 24.80; p<0.0001] and CMS animals continued to differ from control counterparts [F (1, 37) = 9.022; ##p=0.0048]. At the start of the final week of CMS, HAn rats consumed less Froot LoopsTM than LAn rat [F (1, 37) = 12.71; ***p=0.001] and CMS and control animals’ sweet food consumption remained different [F (1, 37) = 5.429; #p=0.025].

