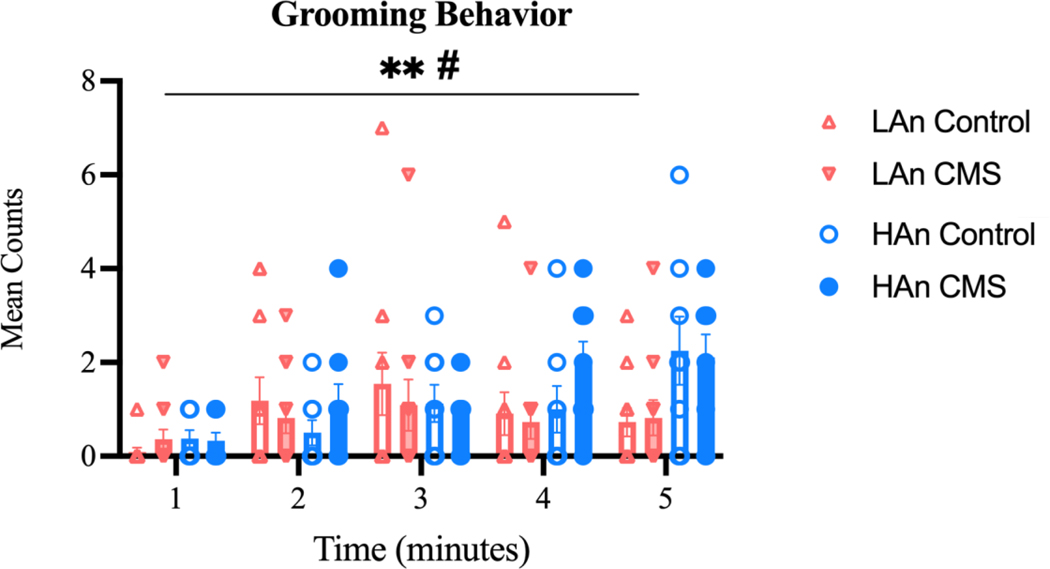
Figure 9. Number of Grooming Behavior Counts.
Scatter plots representing grooming behavior counts across a five-minute test interval. Data are represented as the number of counts ±SEM. Grooming counts changed over time [F (4, 175) = 4.446; **p=0.0019]. Further, HAn and LAn rats differed in their grooming counts over time [F (4, 175) =2.826; #p=0.0264].

