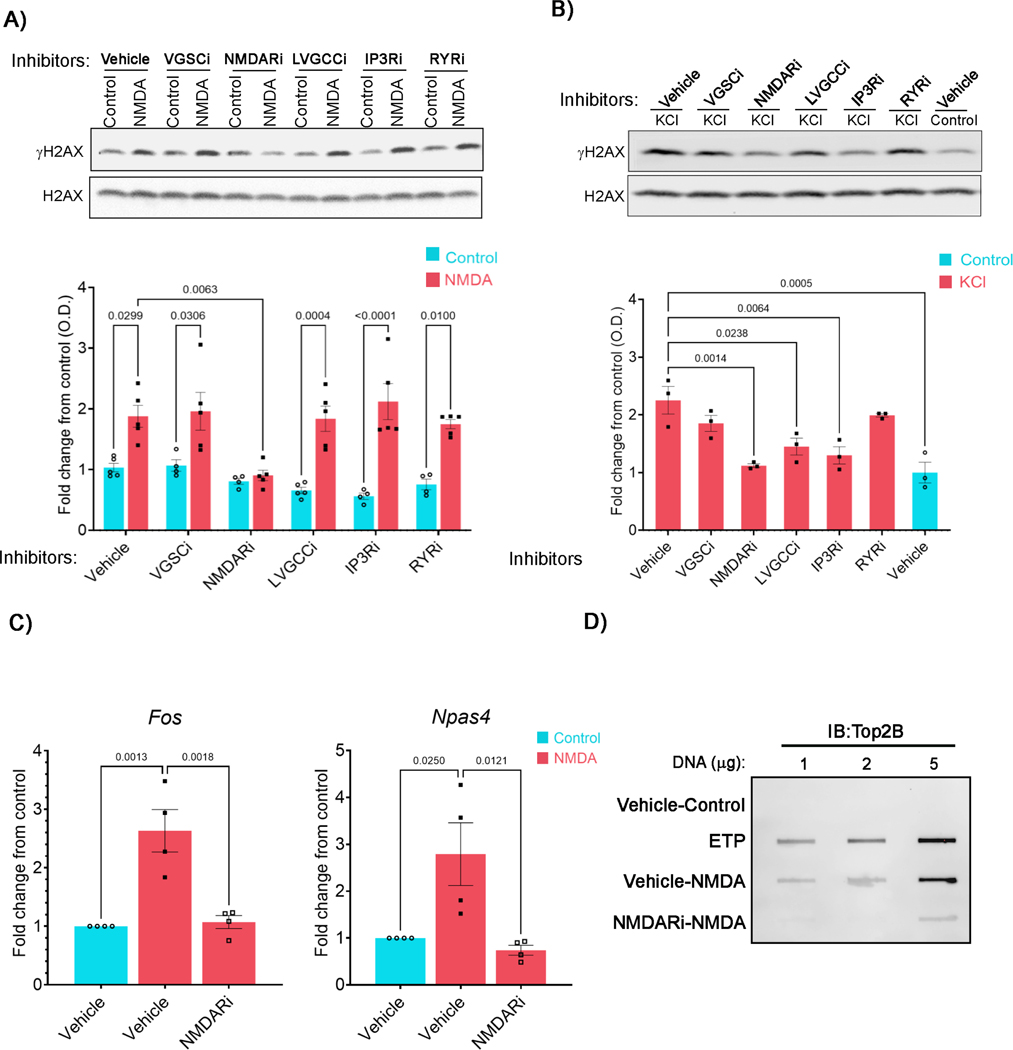
Figure 1. NMDAR activity is required for DSB formation following neuronal stimulation.
(A and B) Cultured neuronswere pre-incubated with either vehicle or the indicated inhibitors. Neurons were then stimulated with either NMDA (A) or KCl (B) and the levels of γH2AX and total H2AX were then assessed by western blotting. Red and blue bars represent normalized γH2AX levels (mean ± s.e.m.) in stimulated and unstimulated neurons (controls) for each treatment expressed as fold change over vehicle control.
(C) γH2AX levels within the gene bodies of Fos and Npas4 were assessed by ChIP-qPCR in neurons that pre-incubated with NMDARi and treated with NMDA.
(D) Neurons were pre-incubated with NMDARi and then stimulated with NMDA as in (A), and the levels of Top2Bccs were assessed. Neurons incubated with etoposide (ETP) were used as a positive control.
See also Figure S1.

