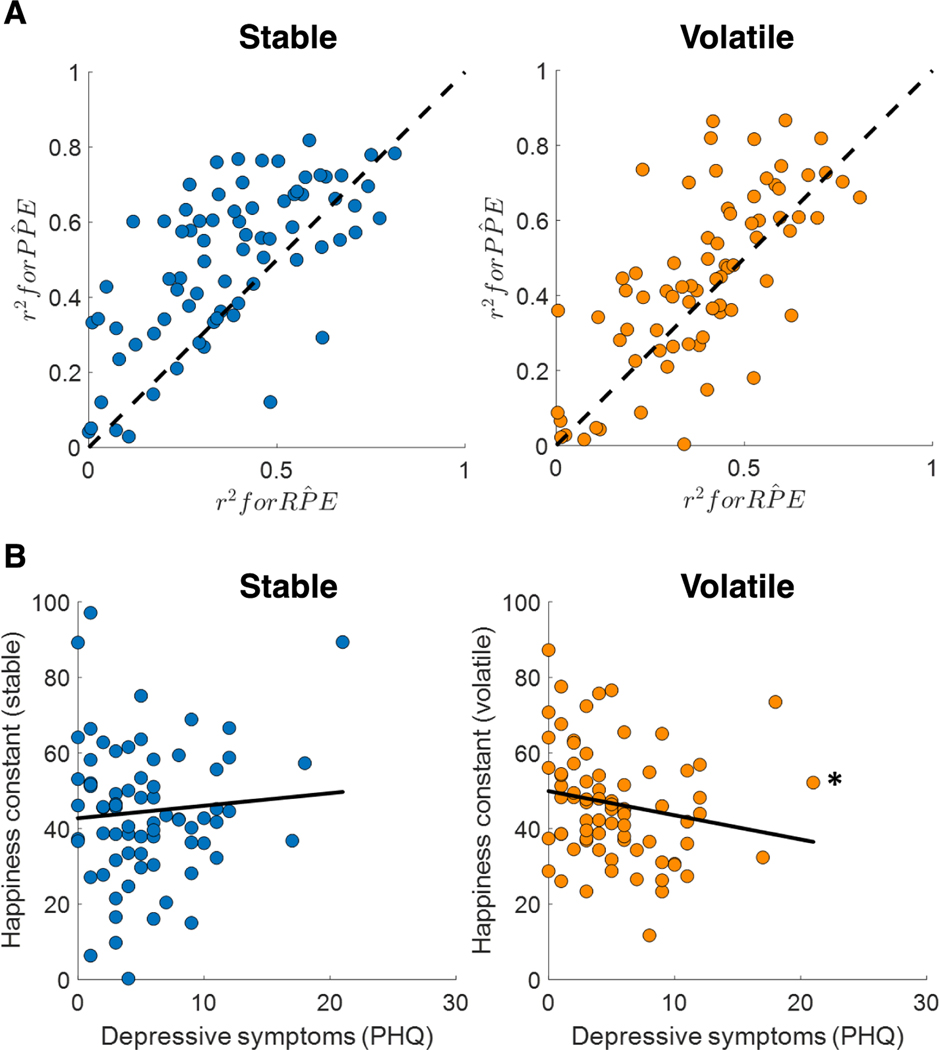
Figure 2. Momentary happiness in a learning task.
(A) The model including probability prediction errors (PPE) performed better than the model including reward prediction errors (RPE) in both stable and volatile environments. Each data point indicates a participant. (B) The happiness constant or baseline mood parameter was correlated with depressive symptoms in volatile but not stable environments. This parameter was estimated from the happiness model that simultaneously quantifies the influence of expected probabilities and probability prediction errors on happiness (Blain & Rutledge, 2020). * p < 0.05.

