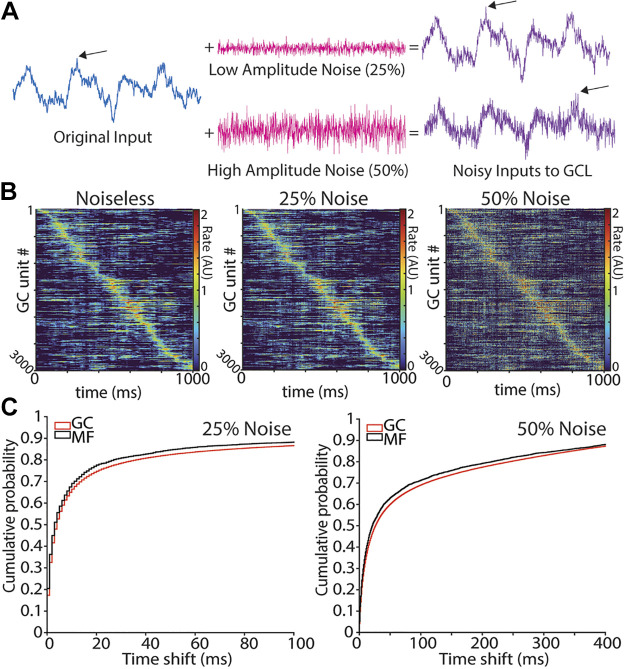
Figure 2.
Effect of increased input noise on GCL peak activity timing. A: example MF input modeled as an OU process without noise (left) and with (right). B: example of a GCL population with stable OU process as input (noiseless; left), and the population with addition of noise (middle and right). The granule cell (GC) population is ordered by timing of peak rate in the noiseless condition. C: cumulative distribution of peak rate time shift between “no noise” and 25% noise (left) or 50% noise (right), with MFs in black and GCs in red. x-axis is bounded to capture ∼85% of population. CDF step length is 1 ms. GCL, granule cell layer; MF, mossy fiber; OU, Ornstein-Uhlenbeck.

