Figure 3.

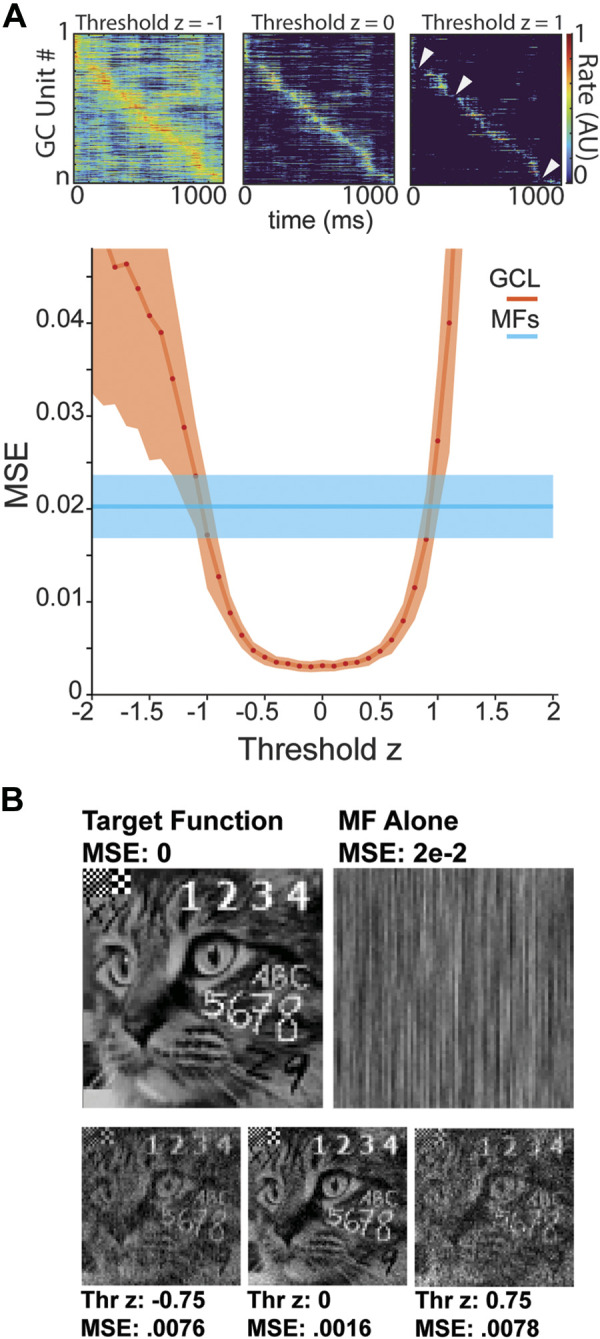
Enhanced time-series learning using GCL model. A, top: GCL output at different threshold levels. Bottom: relationship of threshold level to learning accuracy (MSE) for Purkinje (P) cells fed MFs directly (blue) or the output of the GCL (orange; error, standard deviation). B, top left: P-cells were tasked with learning a complex timeseries that could be rendered as an image recognizable to humans, a cat with superimposed text. Top, right: if P-cells were fed MF input directly, their best learning output was not recognizable as a cat, despite seemingly low MSE of 0.02. Bottom: if P-cells were fed GCL output, they learned timeseries that rendered a matching image, with MSEs dependent on threshold, but varying between 0.0078 and 0.0016. This figure provides an intuitive sense of the practical difference between MSE of 0.02 and 0.0016, achieved with P-cells learning using MFs directly or with the support of GCL preprocessing. GC, granule cell; GCL, granule cell layer; MF, mossy fiber; MSE, mean squared error.
