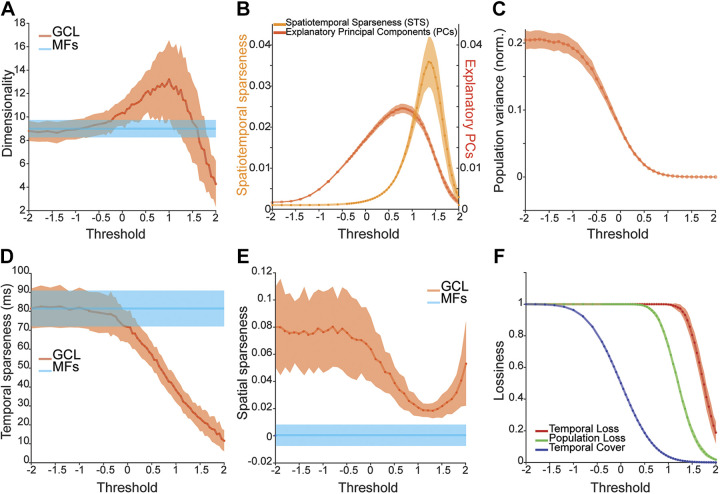
Figure 6.
Statistical features of GCL output. A: GCL dimensionality (red) and MF dimensionality (blue) as a function of threshold. Note peak near a threshold of 1 for the GCL. B: two metrics of pattern separation in GCL output—STS (light orange) and PCs (dark orange)—as a function of threshold. Note peaks near 1.5 and 0.5, respectively. C: the sum of GCL variance produced by the model as a function of threshold. Note monotonic decrease with threshold. D: temporal sparseness as a function of thresholding. Note monotonic decrease in GCL with thresholding. E: mean pairwise correlation of the population plotted as a function of threshold. Note trough near 1. F: three forms of lossiness in GCL output as a function of threshold. Each metric had differential sensitivity to thresholding but note that all decrease with increasing threshold. Across metrics, function maxima and minima ranged widely and were not obviously related to thresholds of optimized learning. GCL, granule cell layer; MF, mossy fiber; PC, principal component; STS, spatiotemporal sparseness.

