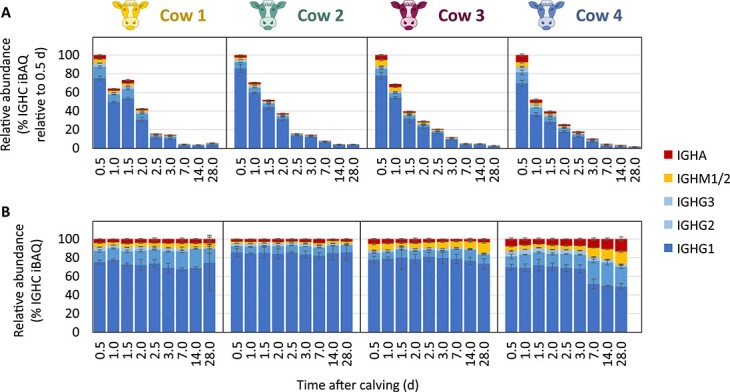
Fig. 3.

Changes in the relative abundances (% iBAQ) of IGHG1 (dark blue), IGHG2 (medium blue), IGHG3 (light blue), IGHM1/2 (yellow), and IGHA (red) in the bovine milk proteome of cow 1, cow 2, cow 3 and cow 4, between 0.5 and 28 d after calving. (A) The decrease of immunoglobulin concentration during lactation is shown by expressing heavy chain constant abundances during lactation relative to those in the first sampled time point. (B) Depicted are the relative abundances of the heavy chain constant regions to each other, irrespective of their abundance in the bovine milk proteome. The error bars represent the standard deviations of triplicate measurements.
