
Figure 4.
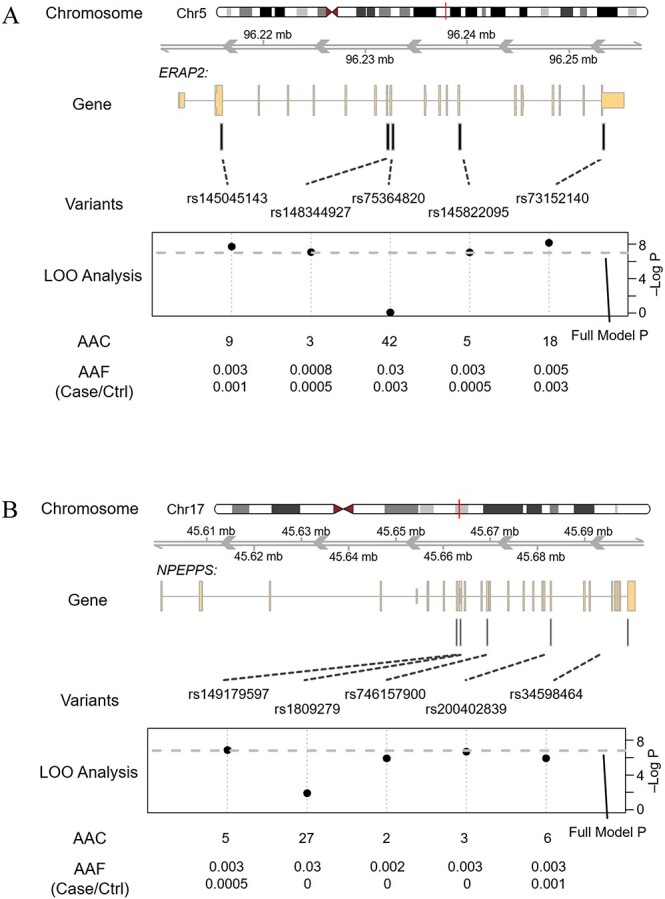
Gene structure plot illustrating the LOO analysis of aggregate signals at gene (A) ERAP2 and (B) NPEPPS.
Official websites use .gov
A
.gov website belongs to an official
government organization in the United States.
Secure .gov websites use HTTPS
A lock (
) or https:// means you've safely
connected to the .gov website. Share sensitive
information only on official, secure websites.
Gene structure plot illustrating the LOO analysis of aggregate signals at gene (A) ERAP2 and (B) NPEPPS.