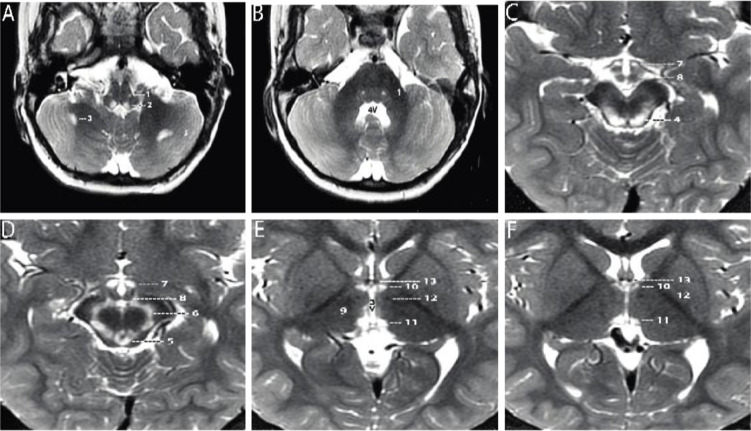
Figure 1. Axial T2-weighted MRI sections of the brain displayed from inferior to superior.
(A–B) Sections through the brainstem and cerebellum. Sections through the medulla (A) and mid pons (B) demonstrate well-defined, symmetrical signal increase in the central tegmental tracts (1) and the nuclei prepositus hypoglossi (2) with very limited, slightly asymmetrical involvement of the white matter of both cerebellar hemispheres (3). 4V=fourth ventricle. (C–D) Sections through the midbrain display intense symmetrical increase in signal in the tectum (4), peri-aqueductal gray matter (5), substantia nigra (6), and medial hypothalamus (7). The mammillary bodies (8) are spared. (E–F) Sections through the hypothalamus (E) and thalamus (F) display intense symmetrical increase in signal in the medial thalamus (9), anteromedial thalamus (10), and habenular nuclei (11), with sparing of the low signal mammillothalamic tracts (12) and anterior columns of the fornix (13). No abnormal signal was identified in any other portions of the brain. 3V=third ventricle.

