. 2023 Mar 7;12:e68047. doi: 10.7554/eLife.68047

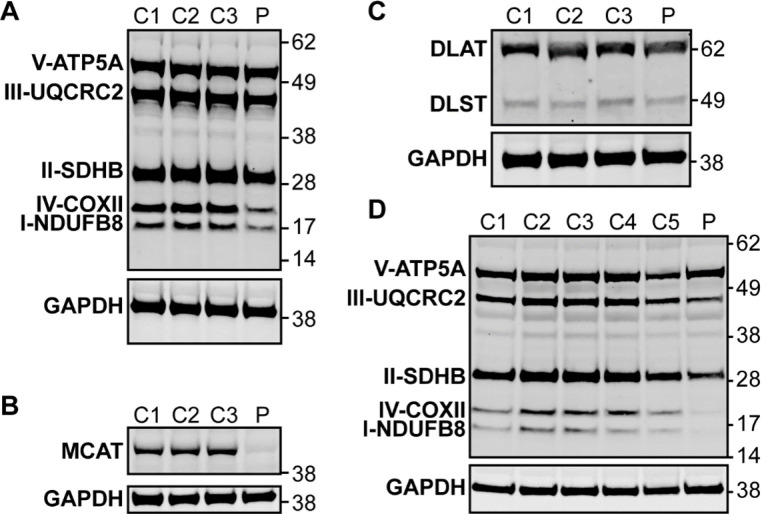
Figure 2. Western blot analysis in patient lymphoblasts (A–C) and fibroblasts (D).

(A) Western blot analysis to assess the expression level of one subunit of each of the five different oxidative phosphorylation complexes in the patient lymphoblast sample (P) compared to three control lymphoblast lines from healthy individuals (C1–3). Protein content of NDUFB8 and COXII, which are subunits of complexes I and IV, respectively, are decreased in the patient compared to healthy controls. (B) Western blot analysis to assess malonyl-CoA-acyl carrier protein transacylase (MCAT) levels reveals decreased expression of MCAT in patient lymphoblasts (P) compared to three controls (C1–3). (C) Western blot analysis to assess lipoylation with an anti-lipoic acid antibody in patient lymphoblasts (P) compared to controls (C1–3) reveals normal lipoylation of the PDH and OGDH E2 components (DLAT and DLST, respectively) in the patient sample. (D) Western blot analysis to assess the expression level of one subunit of each of the five different oxidative phosphorylation complexes in the patient fibroblast sample (P) compared to five fibroblast controls (C1–5). Protein content of NDUFB8, COXII, and SDHB, which are subunits of complexes I, IV, and II, respectively, are decreased in the patient compared to healthy controls.

Figure 2—source data 1. Uncropped immunoblots for Figure 2.
Figure 2—source data 2. Unlabeled immunoblots for Figure 2.

Figure 2.

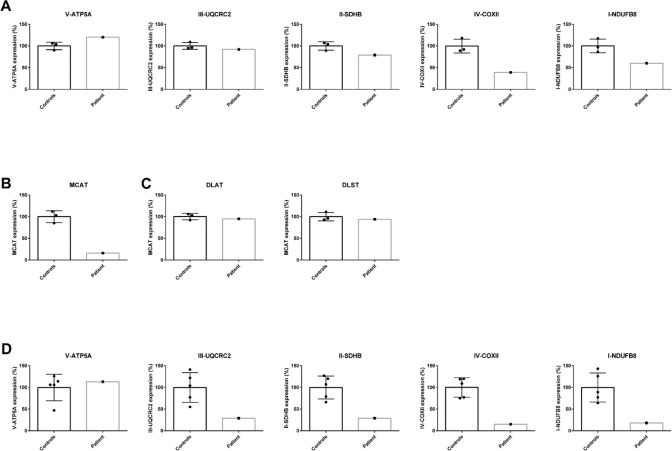
Figure 2—figure supplement 1. Quantification of western blot analysis in patient lymphoblasts (A–C) and fibroblasts (D).

Figure 2—figure supplement 1.

The intensity of the protein of interest was normalized to GAPDH. The average of the controls was set to 100% and the individual values are expressed as a percentage.
Figure 2—figure supplement 1—source data 1. Excel spreadsheet containing quantitative data for Figure 2—figure supplement 1.

Figure 2—figure supplement 2. Measurement of 2-oxoglutaric acid dehydrogenase complex (OGDHc) activity.
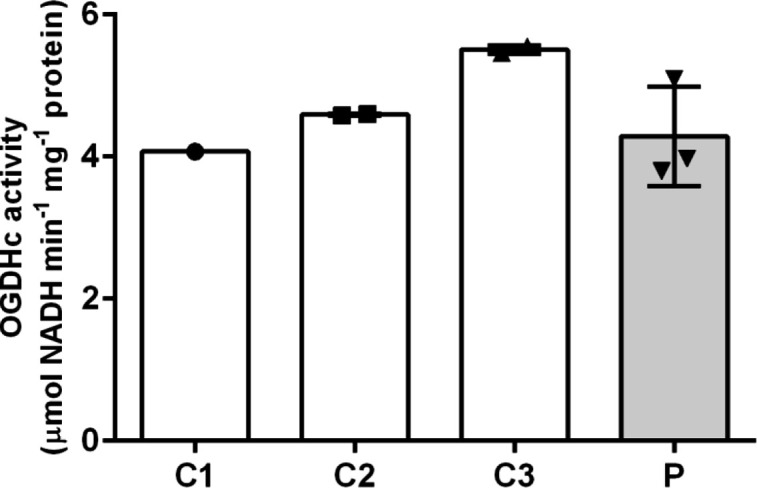
Figure 2—figure supplement 2.

Oxidative decarboxylation of 2-oxoglutaric acid by OGDHc is measured in cell lysates from lymphoblasts from the patient (P) and three healthy controls (C1–3). Control 1 (C1) was a single observation from one cell pellet, controls 2 and 3 (C2 and C3) were duplicate measurements from one cell pellet. For the patient (P), we analyzed two cell pellets, one measured in duplicate and the other measured as a single data point. Standard deviation is shown with the error bars. No deficit in OGDHc activity was identified in the patient sample (P).
Figure 2—figure supplement 2—source data 1. Excel spreadsheet containing quantitative data for Figure 2—figure supplement 2.

Figure 2—figure supplement 3. Relative abundance of lactate, 2-oxoglutarate, and 2-oxoadipate from quantitative metabolomics.
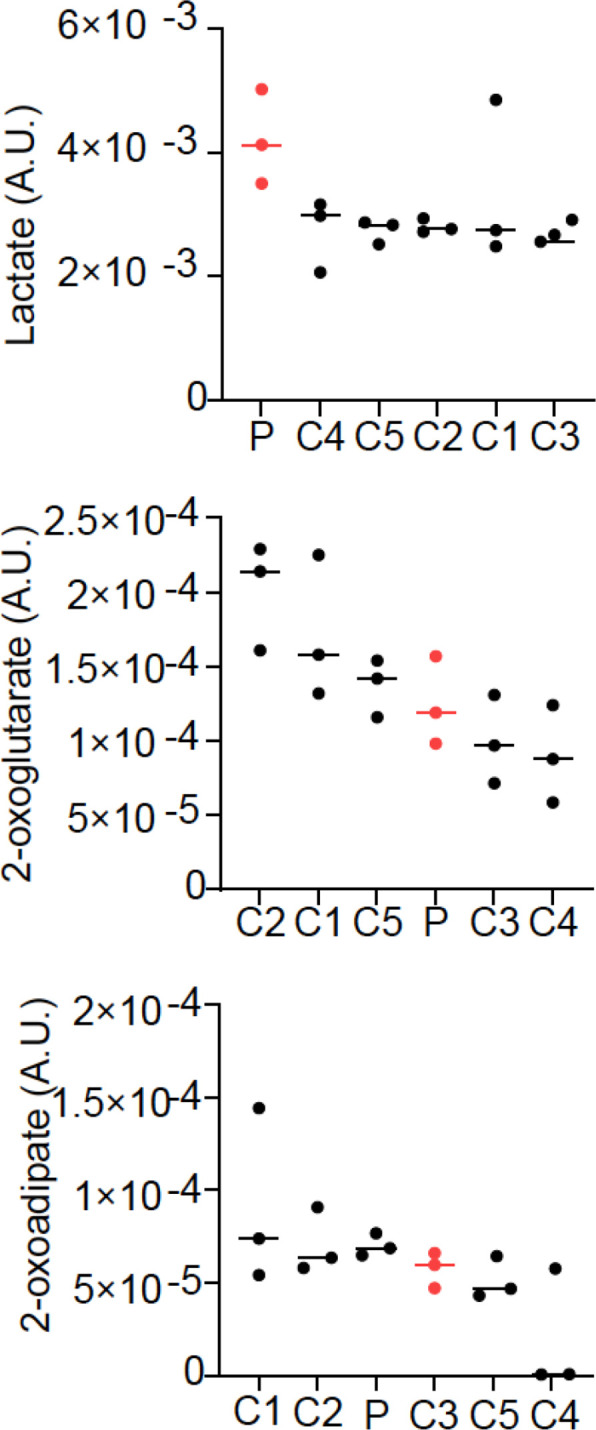
Figure 2—figure supplement 3.

Three cell pellets were collected for the patient fibroblast cell line (P) and each of five control fibroblast lines (C1–5). Lactate was elevated in the patient line, while 2-oxoglutarate and 2-oxoadipate were normal.
Figure 2—figure supplement 3—source data 1. Excel spreadsheet containing quantitative data for Figure 2—figure supplement 3.

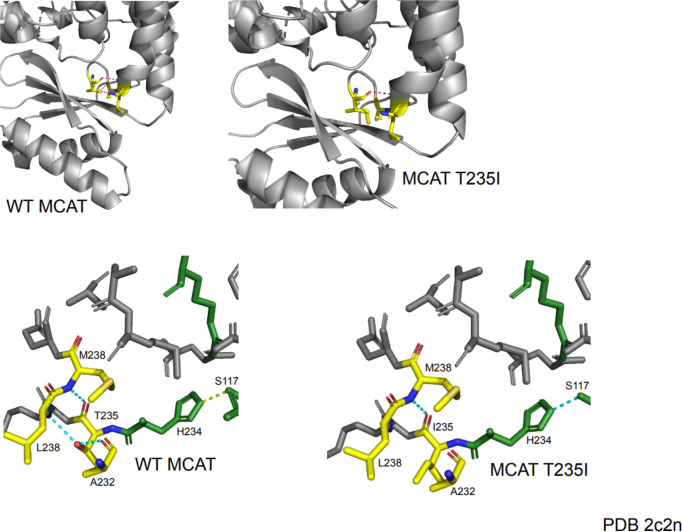
Figure 2—figure supplement 4. Protein modeling of malonyl-CoA-acyl carrier protein transacylase (MCAT) p.T271I mutation.

Figure 2—figure supplement 4.

The T235 residue in the crystal structure corresponds to the residue at the site of the T271I mutation. This mutation occurs one residue away from the active site histidine (H234) and is located in a semi-structured region between the end of an alpha helix and a linker region between the alpha helix and a series of beta sheets. In the wild-type protein, the T235 residue makes several contacts with surrounding residues. The carboxy group of T235 makes contact with the amide nitrogen of M238. The hydroxyl group of T235 forms a hydrogen bond with the carboxyl group of A232 and the amide nitrogen of L238. The mutation of threonine to isoleucine results in a loss of polar contacts with A232 and L238 due to a loss of the hydroxyl moiety. This likely reduces the structure of the end of the alpha helix and may generate additional flexibility of the linker region. Although the mutant protein shows maintenance of a contact between the active site histidine and another active site residue (S117), the proximity of this mutation to the active site may suggest a negative impact on catalytic efficiency.