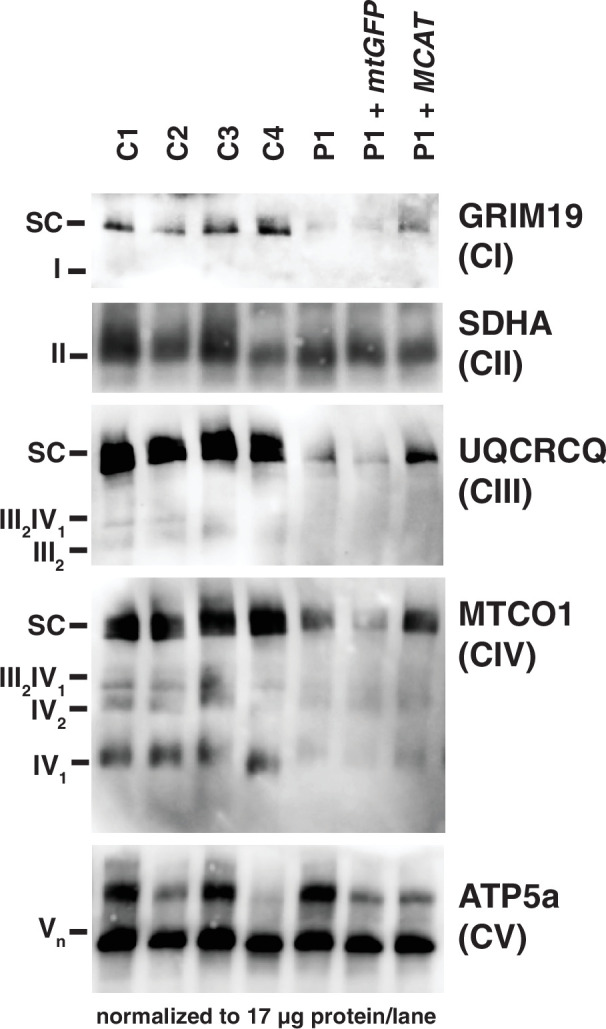
Figure 3. Mitochondrial respiratory supercomplexes visualized by blue-native PAGE.

Mitochondrial lysates generated from four control fibroblast lines (C1–4), the patient fibroblast line (P), the patient line expressing the control plasmid mtGFP (P+mtGFP), and the patient line with re-expression of wild-type malonyl-CoA-acyl carrier protein transacylase (MCAT) (P+MCAT). The lysates are separated by blue-native PAGE and immunoblotted with the indicated antibodies. Expression of GRIM19, UQCRCQ, and MTCO1 delineating supercomplexes I, III, and IV respectively are decreased in the patient cells (P) compared to four controls, and improved with re-expression of wild-type MCAT (P+MCAT). For each immunoblot, at least two technical replicates were completed and one representative blot is shown. SC = supercomplex.
