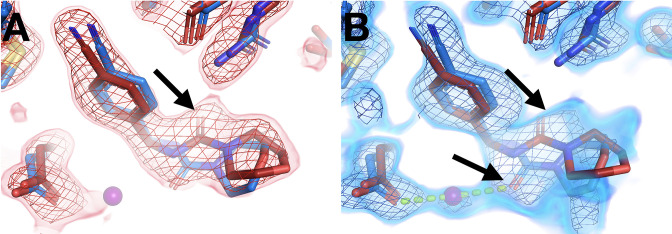
Figure 6. Temperature modulates fragment pose and solvation within the same site.
(A) In the room temperature (RT) dataset (x0260), the RT event map contoured at 1.6 σ (red) matches the RT model (red), but shows little evidence for the cryogenic (cryo) model (y0180, blue). (B) In the corresponding cryo dataset, the cryo event map contoured at 1.6 σ (blue) matches both the cryo model (blue) and the RT model. Notably, only at cryo does the event map include density for a water molecule (purple ball) next to the fragment carbonyl group and well positioned for a hydrogen bond (pale green dashed line) with the cryo fragment pose.

