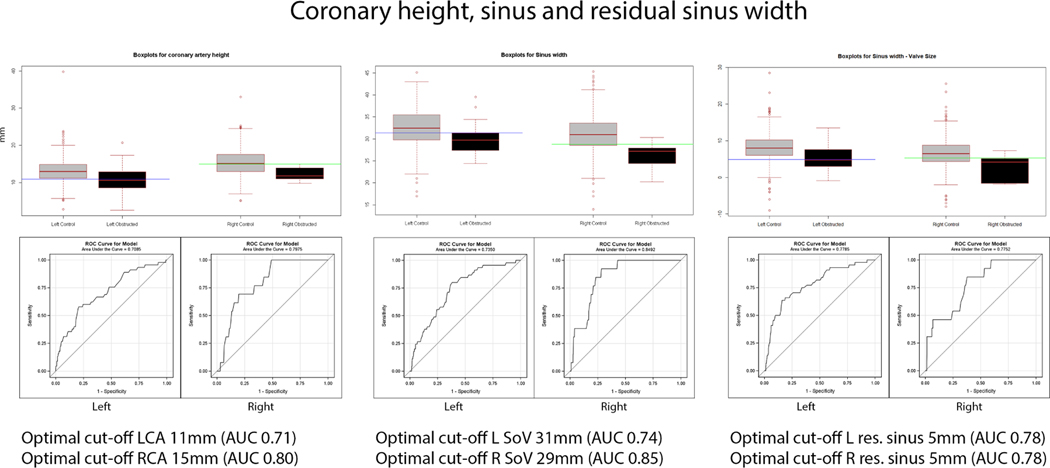
Figure 4. Coronary height, sinus and residual sinus width.
Box and whiskers plots for coronary height, sinus width, and residual sinus volume, with the box encompassing the interquartile range, the centerline within the box representing the median, and the whiskers representing 1.5x the interquartile range and extremes plotted outside these boundaries. Optimal cutoffs and ROC curves for coronary height, sinus width, and residual sinus width are illustrated.

