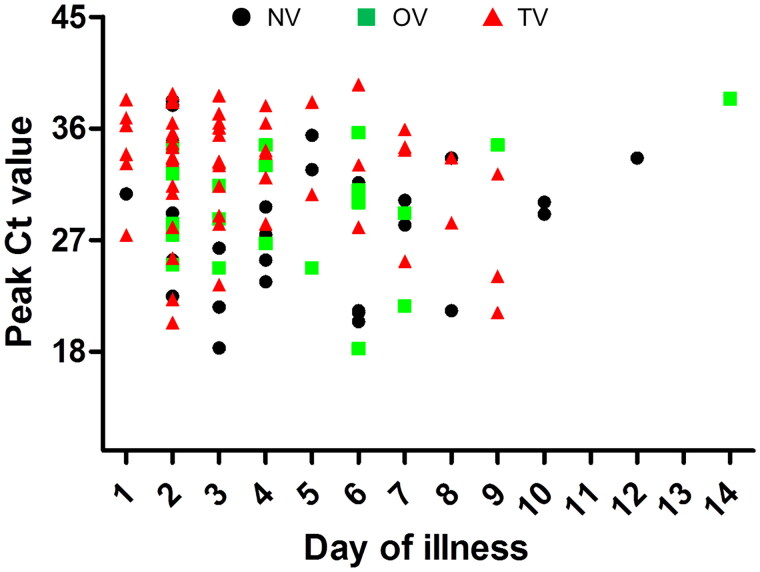
Figure 2.
Scatterplot of peak Ct values and time to peak of viral load among three groups. NV: non-vaccination group (black circle); OV: one-dose vaccination (green square); TV: two-dose vaccination (red triangle), the TV group showed the lower viral load and shorter time to peak than the NV and OV groups (p < 0.05).

