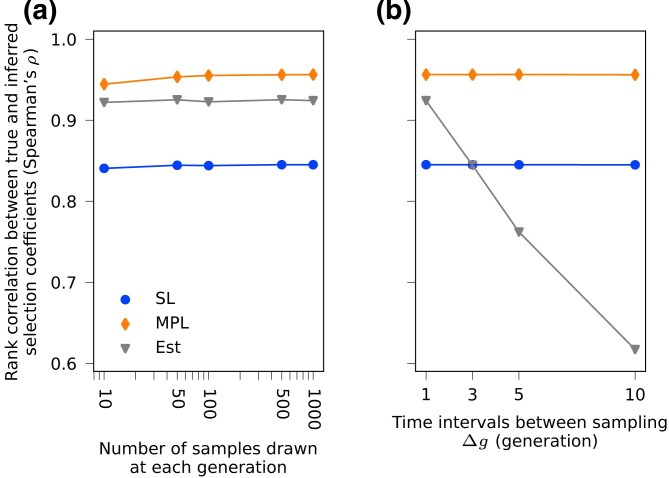
Fig. 4.
Performance is robust to sampling depth but sensitive to sampling time interval. (a) Spearman’s rank correlation coefficients between inferred and true selection coefficients averaged over 200 simulations with same setup as shown in Fig. 1a are compared with different sampling depths. The sampling time interval is 1 generation here. All three methods are robust against shallower sampling depths. (b) The same metrics (Spearman’s ) compared with different sampling time intervals. At each sampling time point all 1,000 samples in the population are used here. The Est method is more sensitive to larger sampling time intervals compared to the MPL and SL methods, and performs worse than the SL method as time interval increases to five generations and above.

