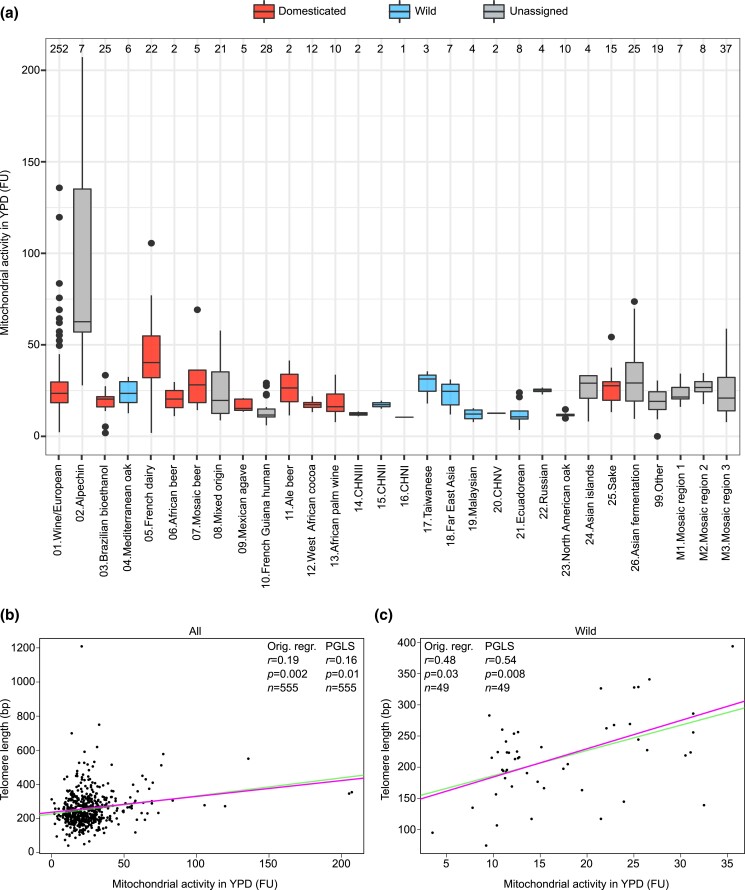
Fig. 5.
TL and mitochondrial phenotypes. a) Mitochondrial activity in YPD of the phylogenetic lineages in the 555 S. cerevisiae collection. Isolates classification is as in Fig. 2. Box plots are as in Fig. 2. FU = fluorescence units. b, c) Associations between mitochondrial activity in YPD and telomere length in the 555 S. cerevisiae collection (left panel) and in the subset of wild isolates (n = 49; right panel). Each point represents a single isolate and the lines represent linear regression functions before (green) and after (pink) correction for phylogenetic signal. The association is significant when considering both the whole dataset (n = 555) and only the wild isolates. The other 3 mitochondrial phenotypes (mitochondrial activity and volume in YPD and YPEG) show similar trends but they are not shown for simplicity, while the copy number of mitochondrial DNA negatively correlates with telomere length (P < 0.05). Orig. regr = original regression.

