
Figure 6.
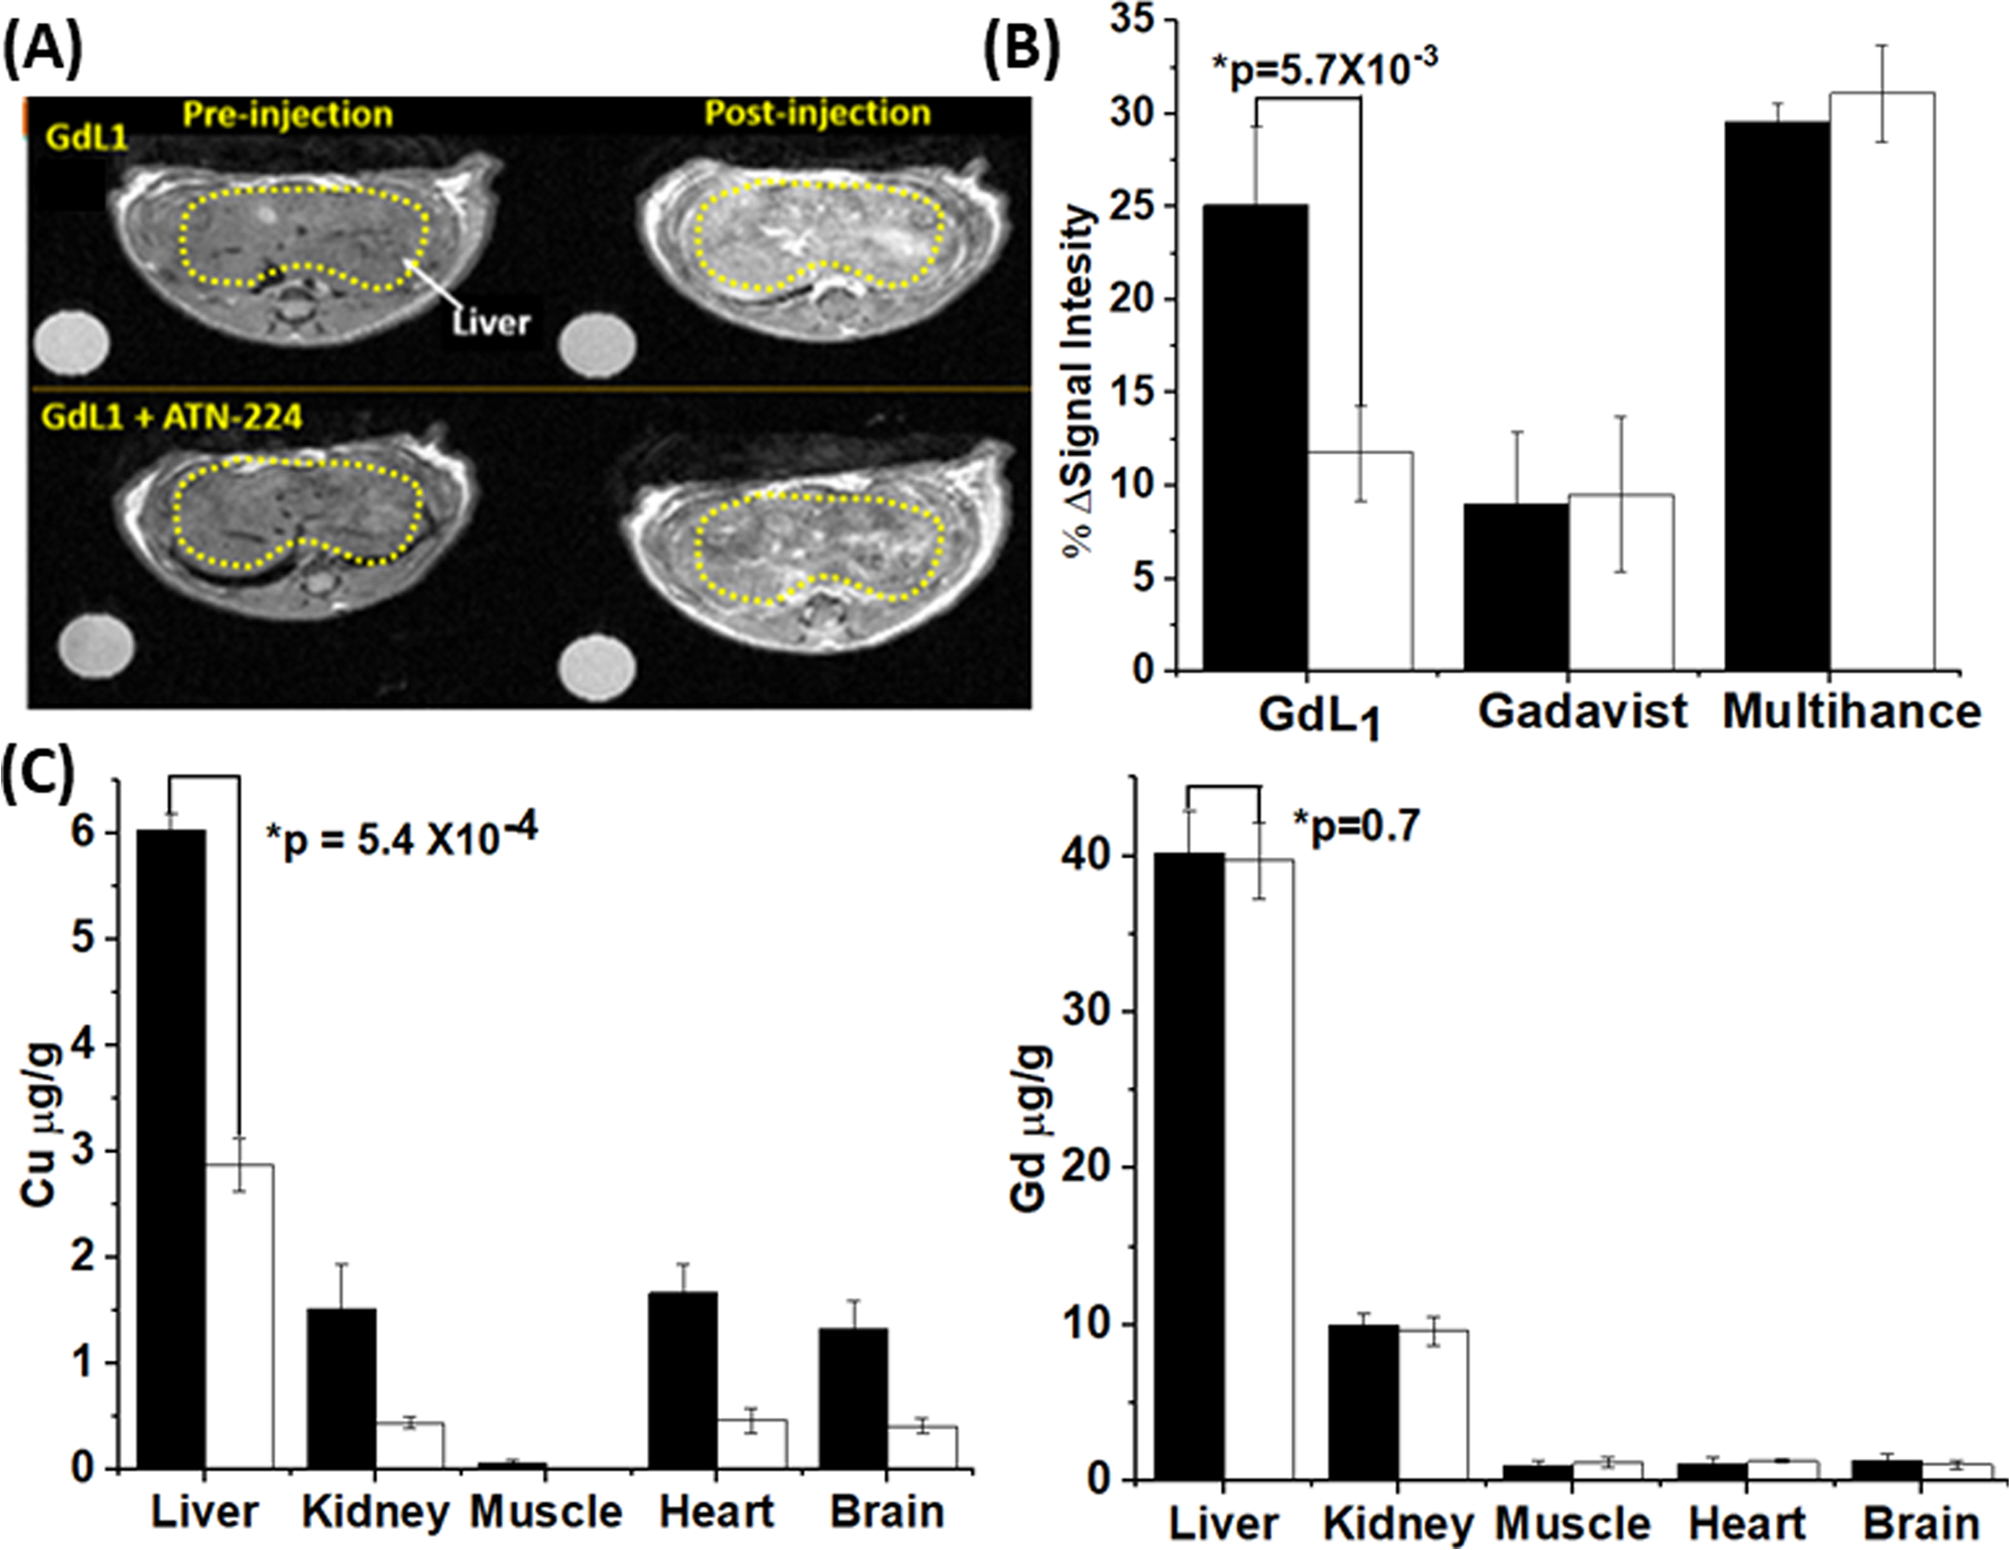
(A) In vivo MRI images of wild type mouse (n = 3) pre- and postinjection of GdL1 (0.1 mmol/kg) without (top) or with (bottom) pretreatment with ATN-224 (5 mg/kg in 50 μL). All images were obtained at 4.7 T. (B) The average MRI signal intensity of mouse liver 6 min after injection of either GdL1 or Gadavist in control mice (black bars) versus mice pretreated with ATN-224 (white bars). The columns on the right show average liver signal intensities at 13 min after injection with Multihance. The data were compared using a two-tailed student t test. *p < 0.05 (n = 3); error bars reflect ± SD. (C) Total Cu and Gd (μg/g of tissue) in various tissues collected from control mice (black bars) and from mice pretreated with ATN-224 (white bars) 6 min after the injection of GdL1. Tissue copper levels relative to tissue wet weight were determined by ICP-MS. The data were compared using a two-tailed student t test. *p < 0.05 (n = 3); error bars reflect ± SD.