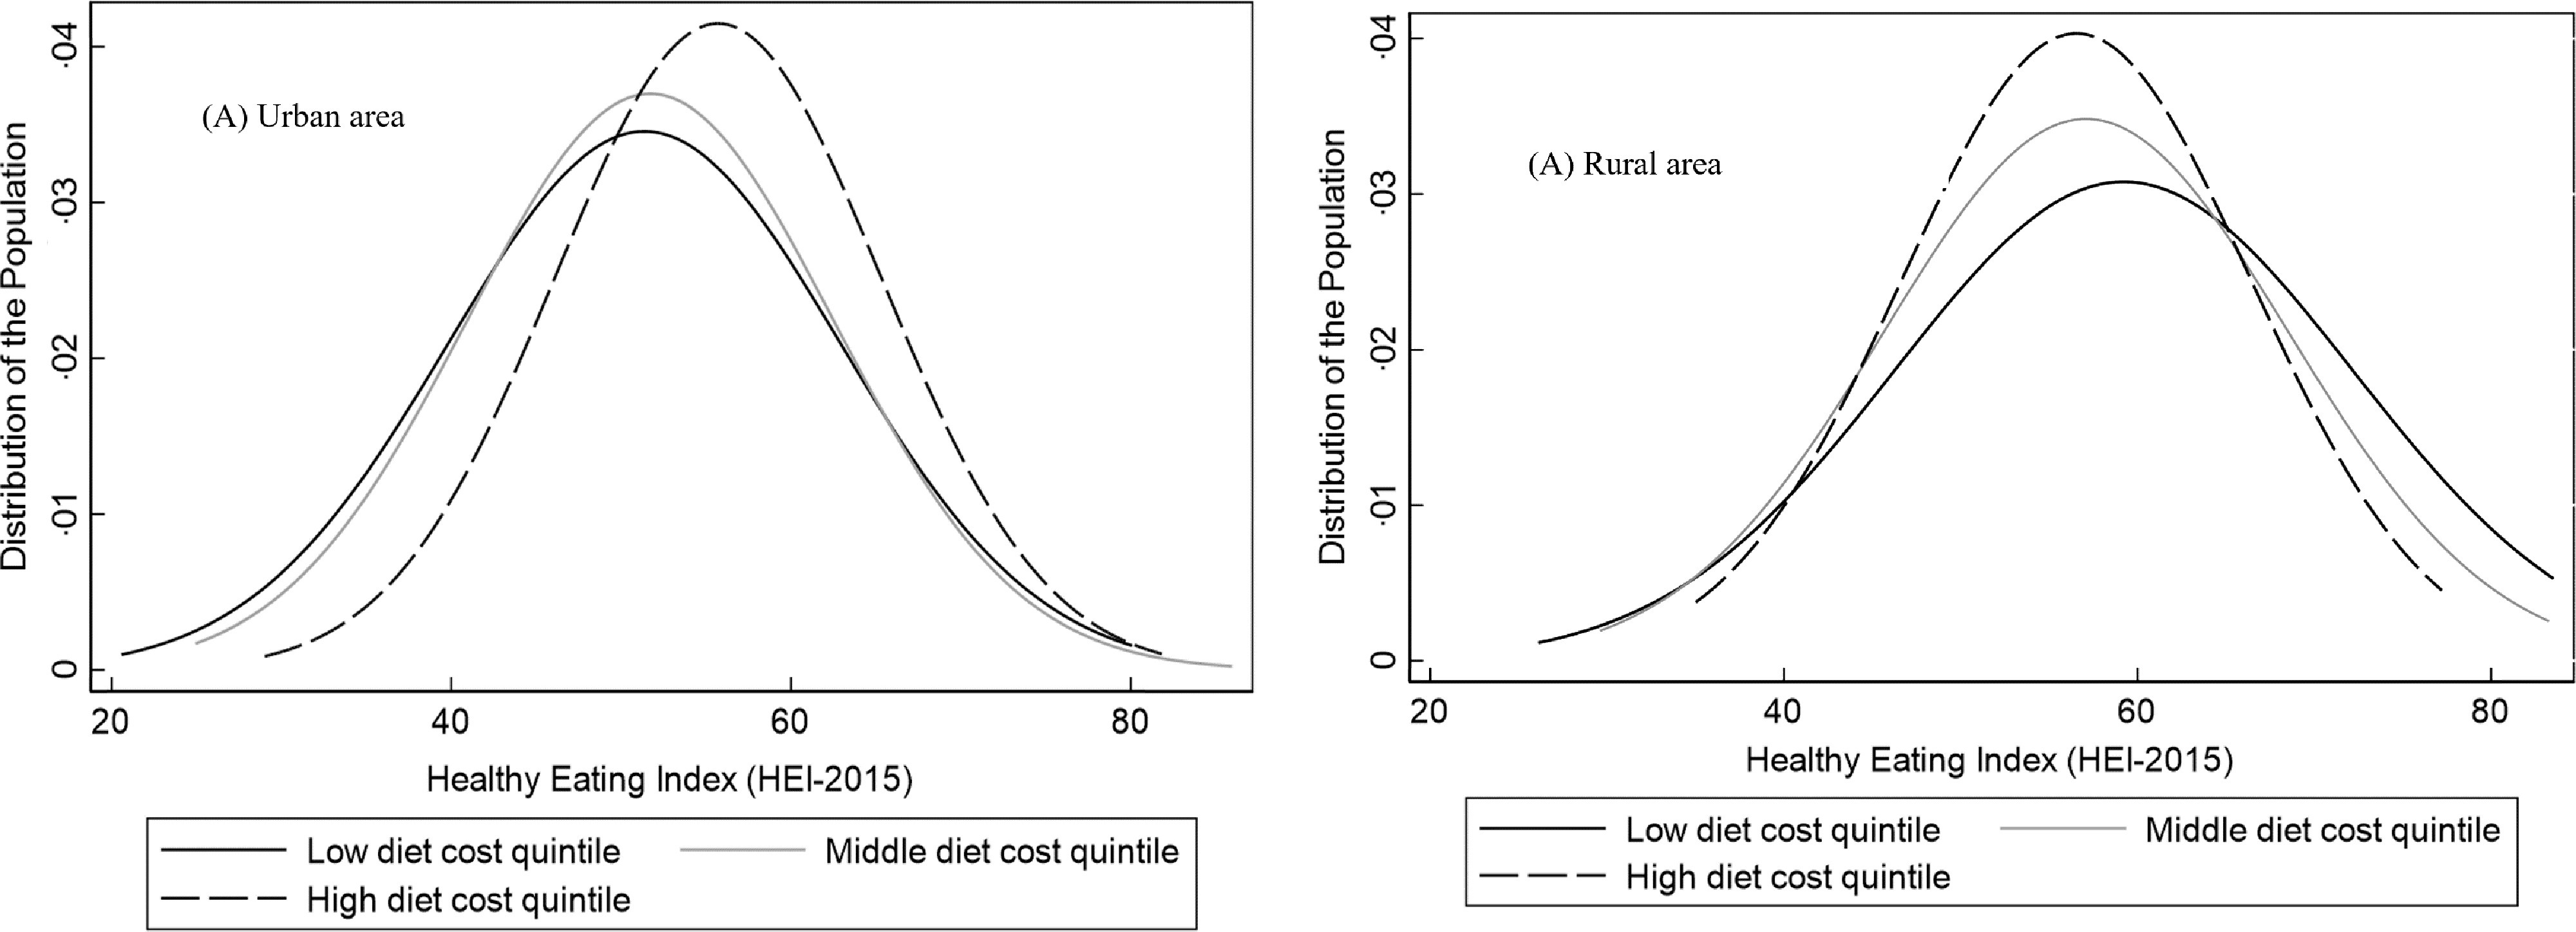
Fig. 1.

Distribution of Healthy Eating Index-2015* score by low, middle and high quintiles of diet by area of residence. *Diet quality was adjusted by socio-demographic variables using the multiple linear regression model adjusted for sex, age, socio-economic status, education and ethnicity
