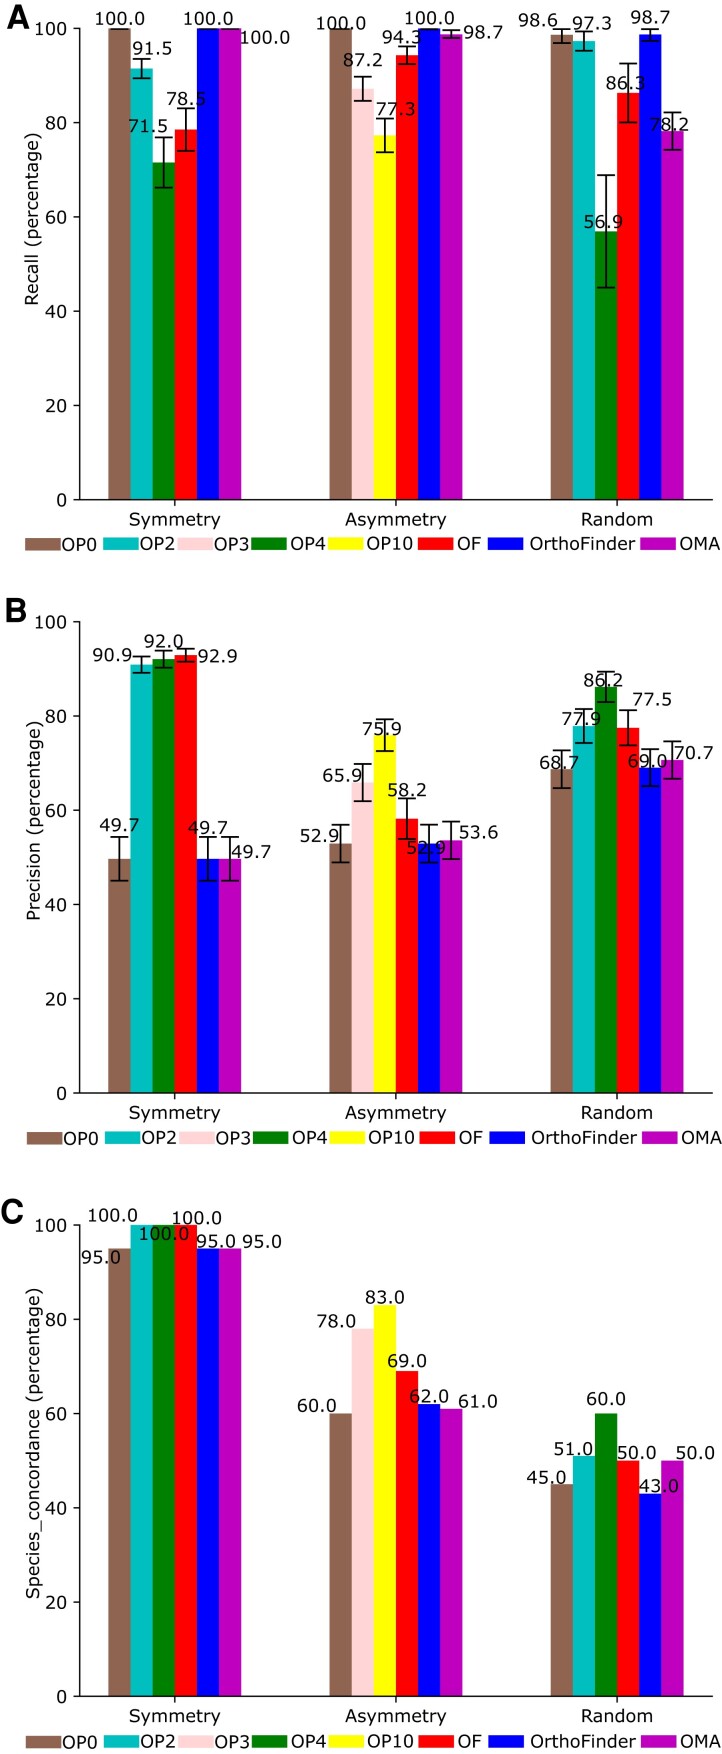
Fig. 1.
Performance of ortholog inference for three model trees. Evaluation of (A) Recall, (B) Precision, and (C) Species_concordance (concordance rate between species phylogenetic trees and phylogenetic tree models) for three phylogenetic tree models: symmetry, asymmetry, and random. Brown: OrthoPhy without taxonomic information (OP0); light green: OrthoPhy with taxonomic information for two groups (OP2); light pink: OrthoPhy with taxonomic information for three groups (OP3); dark green: OrthoPhy with information for four groups (OP4); yellow: OrthoPhy with information for ten groups (OP10); red: OF (OF); blue: OrthoFinder; and purple: OMA.

