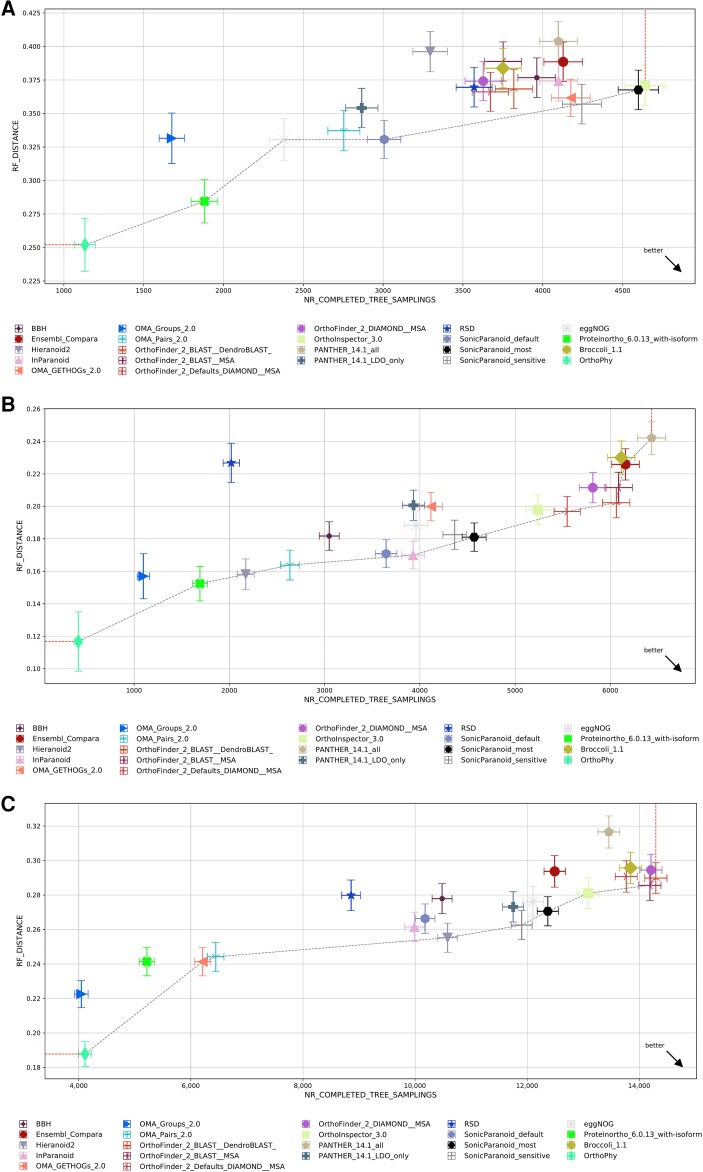
Fig. 3.
Results of the benchmark test of Quest for Orthologs. The results of each program with the same benchmark test are indicated in the graph. The horizontal axis indicates the number of orthologous phylogenetic trees used in the test, and larger values indicate that more orthologs were inferred. The vertical axis shows the average Robinson–Foulds distance between the species phylogenetic tree and the ortholog phylogenetic trees. OrthoPhy is indicated by a yellow-green rhombus. OrthoPhy results of (A) “Generalized Species Tree Discordance Benchmark (LUCA)” with three-domain information; (B) “Generalized Species Tree Discordance Benchmark (Eukaryota)” with eukaryotes information; and (C) “Generalized Species Tree Discordance Benchmark (Fungi)” with fungi information.

