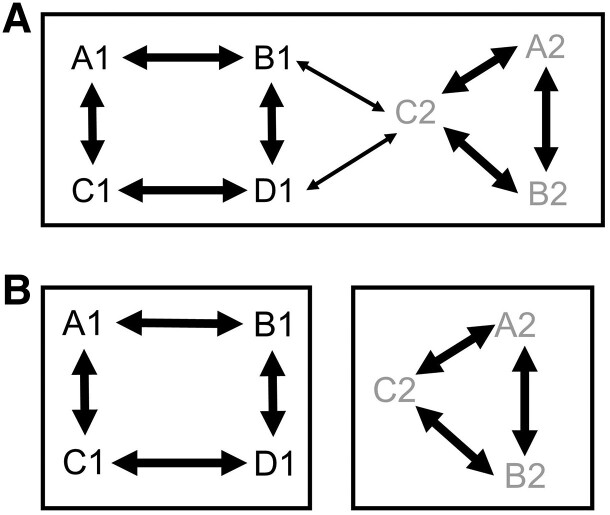
Fig. 5.
Markov clustering results based on different inflation values. Sequences connected by a two-way arrow indicate reciprocal best-hit pairs, and thick arrows indicate higher similarity. Letters and numbers represent species and sequences, respectively. Black and gray sequences are paralogous with each other, and sequences of the same color are orthologs. Candidate ortholog groups obtained for inflation values of (A) 1.2 and (B) 2.0. In (A), paralogs are included in the same group surrounded by a black border. In (B), paralogs are divided into two groups consisting only of orthologs.

