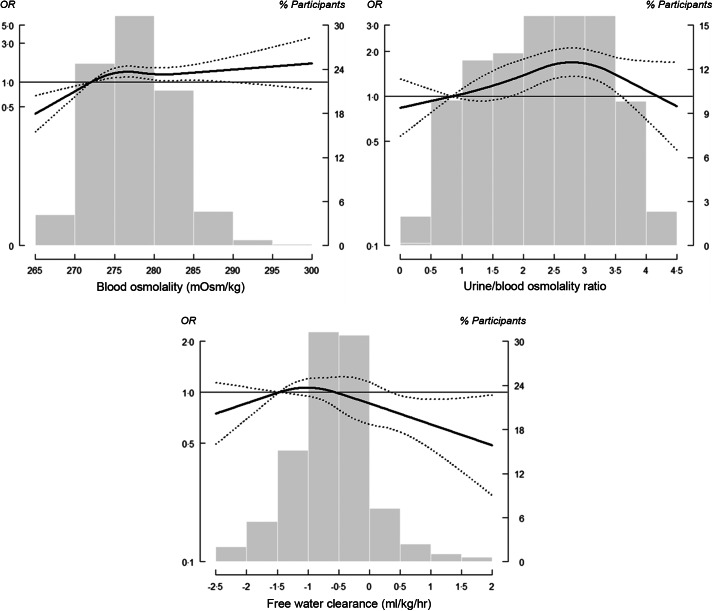
Fig. 3.
OR of kidney stone formation (determined by blood osmolality-based hydration indices). Solid lines represent adjusted OR based on restricted quadratic splines for blood osmolality-based hydration indices (including blood osmolality, osmolality ratio of urine to blood and free water clearance (FWC) with knots at the 10th, 50th and 90th percentiles (corresponding to 272, 278 and 283 mg/dl, respectively, for urine creatinine; and 0·84, 2·28 and 3·44 mOsm/kg, respectively, for urine osmolality; and –1·47, –0·59 and 0·2 ml/kg/h, respectively, for FWC). Dotted lines represent upper and lower 95 % CI. Reference was set at the 10th percentile of the distribution. Adjustment factors were identical to those used in Model 3 (Table 2). Bars represent a histogram of distribution of analysed urine concentration indicators among participants (extreme tails of the histogram were truncated)

