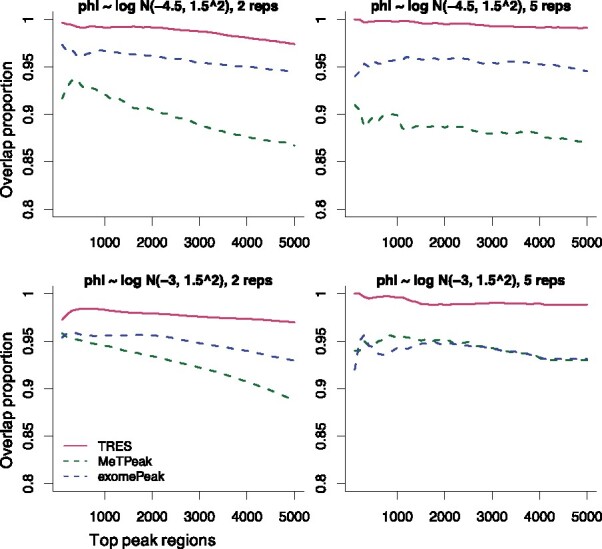
Fig. 3.

Comparison of overlap proportions among top 5000 peaks called by different methods. One panel presents results under one specific scenario. Panels from left to right in each row contain results with number of replicate 2 and 5. Panels from top to bottom in each column represent results with the mean of log-dispersion -4.5 and -3
