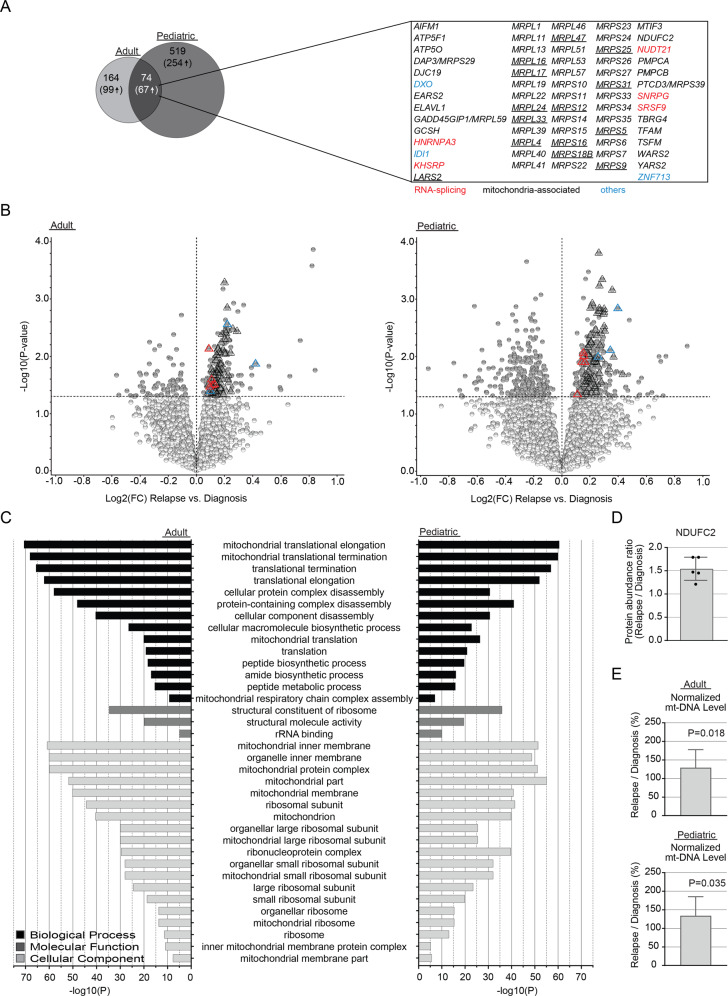
Fig. 2. Proteins with altered abundance associated with AML relapse.
A Left: Venn diagram depicting the intersection of diagnosis versus relapse-specific proteins with significantly altered abundance (P < 0.05) between the adult and pediatric cohorts. The number of significantly altered proteins are indicated, with numbers within parentheses specifying proteins upregulated at relapse. In the right-hand panel, the gene annotation for the intersection of significantly altered proteins upregulated at relapse in adults and children is listed. Proteins linked to mitochondrial functions are shown in black, those associated to RNA-splicing are highlighted in red, with the rest being depicted in blue. Underlined proteins indicate the proteins part of the intersection between the adult and pediatric cohort and the corresponding differential protein abundance analysis performed by Aasebø et al. [18]. B Volcano plots presenting proteins with altered abundance with proteins downregulated (log2FC < 0) and upregulated (log2FC > 0), respectively, at relapse in comparison to patient-matched diagnosis samples, for adult (left) and pediatric (right) cases. Proteins with altered abundance following P < 0.05 are highlighted in dark gray. Triangles indicate the intersection of significantly altered proteins upregulated at relapse in adults and children, as shown in panel A. C GO-analysis of relapse-associated significantly altered proteins for adult (left) and pediatric (right) cases. All presented GO-terms are enriched among proteins upregulated at relapse, compared to paired diagnosis samples (P < 0.05). Only shared GO-terms between the adult and pediatric cohort, with an FDR < 0.01 and a minimum enrichment score of three, are included. D Bar diagrams presenting the mean protein abundance ratio (relapse/diagnosis) based on densitometry analysis of immunoblots of NDUFC2, after normalization to the β-Actin loading control. Original immunoblots and case-based protein abundance ratios are presented in Supplementary Fig. 3. E Bar diagrams presenting the mean ratio of mitochondrial DNA read depth over the mean read depth of the nuclear genome, as presented by the ratio at relapse divided by the ratio at diagnosis. Visualization and underlying statistical calculations were performed by using Qlucore omics explorer v.3.6. (A and B), the Gene Ontology enRIchment anaLysis and visuaLizAtion tool (C), and GraphPad v.9.1.2 (D and E). For E, the applied statistical test was Non-parametric One sample Wilcoxon signed rank test with theoretical median = 100. Supplementary Table 8A–D presents details regarding samples included in this figure, Supplementary Table 9 presents details for all proteins with altered abundance and Supplementary Table 10 presents details for all GO-terms. FC fold change, FDR false discovery rate (Benjamini–Hochberg adjusted P-values), GO gene ontology, mt mitochondria.

