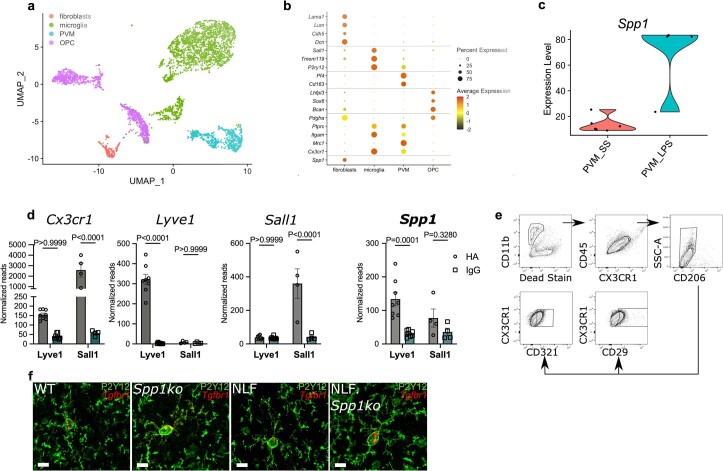
Extended Data Fig. 6. scRNA-seq and translatome analysis of perivascular cells and microglia.
(a) UMAP plot of 4,238 cells, color-coded based on the inferred cell type. (b) DotPlot of gene expression for a series of known cell type markers for fibroblasts (Lama1, Lum, Cdh5, Dcn), microglia (Sall1, Tmem119, P2ry12), PVMs (Pf4, Cd163), and OPC (Lhfpl3, Sox6, Bcan). Expression of genes encoding for markers used for FACS of cells prior to scRNA-seq (Pdgfra, Ptprc, Itgam, Mrc1, Cx3cr1) and for Spp1 is also included. Radius of dot is proportional to the percentage of cells expressing the gene, color is the scaled gene expression level. (c) Violin plot of Spp1 expression reanalyzed from Jung-Seok Kim et al.11. (d) RiboTag-based translatome analysis of pooled oAβ and PBS-challenged brain homogenates of Cx3cr1ccre:Lyve1ncre (n = 8 mice) and Cx3cr1ccreSall1ncre:RiboTag-mice (n = 4 mice). Normalized reads of pan macrophage marker (Cx3cr1), PVM marker (Lyve1), microglia marker (Sall1) and Spp1. P Values from two-way ANOVA, Bonferroni’s multiple comparison test. Data are shown as Mean ± SEM. Data are from 1 independent experiment. (e) Gating strategy to identify CD321 (F11r) and CD29 (Itgb1) expression in microglia (CX3CR1highCD45+ CD206- CD11b+). (f) Representative image of P2Y12+ microglia expressing tgfbr1, assessed by smFISH-IHC in 6 mo AppNL-F and AppNL-F.Spp1KO/KO SLM. Scale bar represents 10 µm. Data representative of n = 3 mice per genotype examined over 1 independent experiment.

