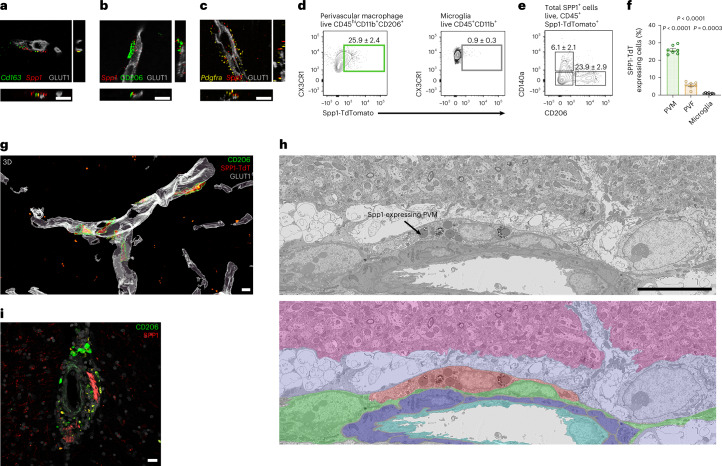
Fig. 2. SPP1 is expressed by PVMs and fibroblasts.
a–c, Representative images of Spp1 mRNA expression juxtaposed to GLUT1+ vasculature, colocalizing with pan-PVM markers Cd163 (a), CD206 (b) and PVF (Pdgfra+) (c) in 6-month AppNL-F SLM as characterized by smFISH-IHC. Scale bar represents 10 µm. Data are representative of four AppNL-F mice examined over two independent experiments. d–f, Representative FACS plots to identify PVMs (CX3CR1+CD45+CD11b+CD206+ (d), microglia CX3CR1highCD45+CD11b+ (e) or gated on total TdT expressing cells isolated from Spp1TdT hippocampal homogenates and quantification (f)). One datapoint represents one cell type per mouse (PVM, PVF and microglia) pooled from n = 7 mice examined over two independent experiments (f). P values from one-way ANOVA, Kruskal–Wallis test. g, Three-dimensional reconstruction of CD206+ PVMs expressing SPP1-Td along GLUT1+ vessels in SLM from Spp1TdT mice. Scale bar represents 7 µm. Data are representative of three Spp1TdT mice examined over two independent experiments. h, Representative single serial section SEM backscatter electron image of a representative SPP1-TdT-positive PVM as identified by CLEM (Upper). SPP1-TdT-positive cell manually pseudocolored red, together with neuropil (pink), astrocytes (lilac), smooth muscle cells (purple), endothelial cells (cyan) and other perivascular cells (green), shown with reduced opacity over the electron microscopy data (lower). Accompanying confocal overlays and correlation images shown in Extended Data Fig. 3e,d array tomography data shown in Supplementary Video 1. Scale bar represents 10 µm. i, Representative image of perivascular SPP1 in AD postmortem hippocampal tissue, costained with CD206. Scale bar represents 25 µm. Data are representative of n = 6, six different patient tissues (Supplementary Table 1). Data are shown as mean ± s.e.m. TdT, TdTomato.

