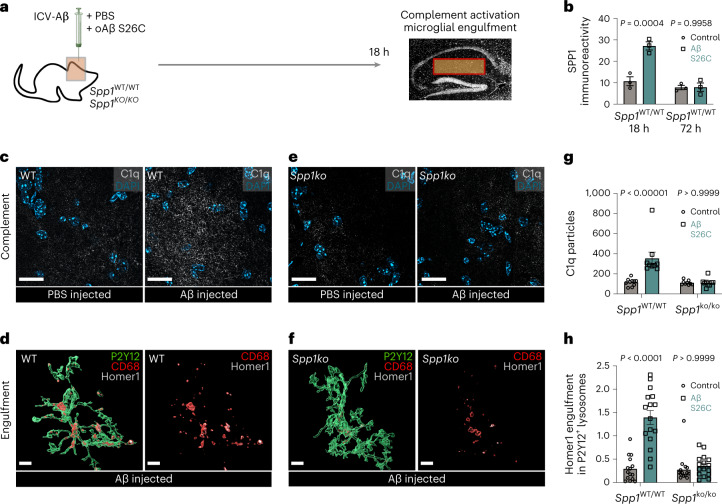
Fig. 3. Spp1 modulates complement activation and microglial synaptic engulfment upon acute oAβ challenge.
a, Scheme illustrating ICV injection of S26C oAβ versus PBS in WT versus Spp1KO/KO mice, 18 h before tissue collection and analysis. b, Quantification of SPP1 immunoreactivity within SLM of 3-month WT mice injected with oAβ versus PBS control, at either 18 h or 72 h post-ICV injection. One datapoint represents one ROI per mouse hippocampus, with total of n = 3 mice per genotype and time point, examined over one independent experiment. P values from two-way ANOVA. c, Representative images of C1q expression in SLM of 3-month PBS versus oAβ-injected WT mice. Scale bar represents 20 µm. d, Representative 3D reconstructed images showing Homer1 engulfment within CD68+ lysosomes of P2Y12+ microglia from WT mice injected with oAβ. Scale bar represents 5 µm. e, Representative images of C1q expression in Spp1KO/KO mice injected with PBS versus oAβ. f, Representative 3D reconstructed images showing Homer1 engulfment within CD68+ lysosomes of microglia from Spp1KO/KO mice injected with oAβ. Scale bar represents 5 µm. g, Quantification of C1q particles (puncta) in WT or Spp1KO/KO mice treated with either PBS or oAβ, as in c and e. One datapoint represents one ROI, with total of 10 (WT) and 9 (Spp1KO/KO) ROIs pooled from n = 3 mice per genotype, examined over two independent experiments. P values from two-way ANOVA. h, Quantification of Homer1 engulfment in WT or Spp1KO/KO P2Y12+ microglia, ICV treated with either PBS or oAβ, as in d and f. One datapoint represents one individual P2Y12+ microglia with a total of 15–16 cells pooled from n = 2 animals per genotype examined over two independent experiments. P values from two-way ANOVA. Data are shown as mean ± s.e.m.

