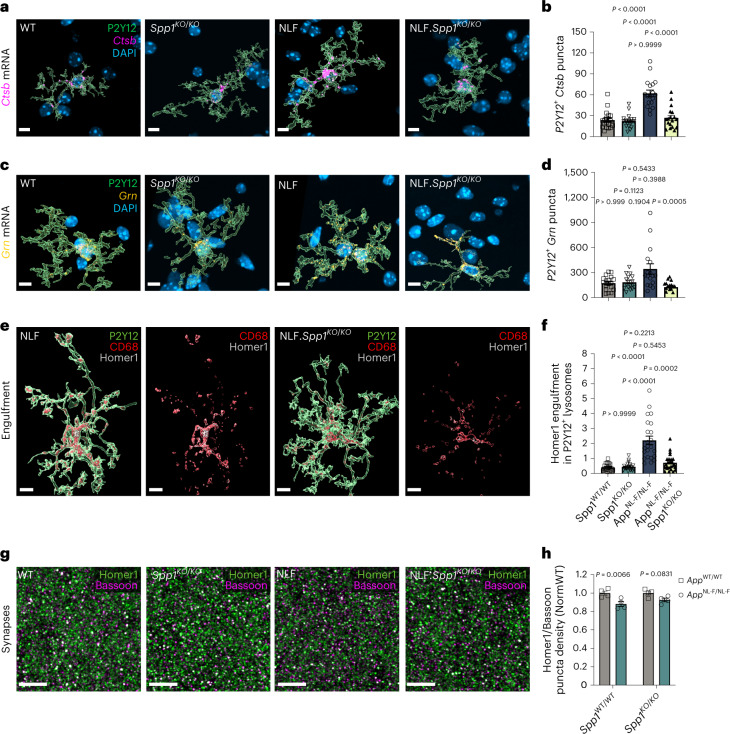
Fig. 4. SPP1 drives microglial engulfment of synapses in AD context.
a–d, Representative image of 3D reconstructed P2Y12+ microglia expressing phagocytic markers Ctsb (a,b) and Grn (c,d) assessed by smFISH-IHC in 6-month WT, Spp1KO/KO, AppNL-F and AppNL-F·Spp1KO/KO SLM. Scale bar represents 7 µm. Quantification of Ctsb (b) and Grn (d) mRNA levels expression within P2Y12+ microglia. One datapoint represents one individual P2Y12+ microglia with a total of 18 microglia (b) and 18 (WT, Spp1KO/KO), 17 (AppNL-F) and 15 (AppNL-F·Spp1KO/KO) microglia (d) pooled from n = 3 mice per genotype examined over two independent experiments. P values from one-way ANOVA, Kruskal–Wallis test. e, Representative 3D reconstructed images showing Homer1 engulfment within CD68+ lysosomes of P2Y12+ microglia in 6-month AppNL-F versus AppNL-F·Spp1KO/KO SLM. Scale bar represents 7 µm. f, Quantification of Homer1 engulfment ratio in P2Y12+ microglia of WT versus Spp1KO/KO versus AppNL-F versus AppNL-F·Spp1KO/KO mice. One datapoint represents one individual P2Y12+ microglia with a total of 23 (WT, AppNL-F), 24 (Spp1KO/KO) and 25 (AppNL-F·Spp1KO/KO) microglia pooled from n = 3 mice per genotype examined over two independent experiments. P values from one-way ANOVA, Kruskal–Wallis. g, Representative super-resolution images of Homer1 and Bassoon puncta colocalization in 6-month WT, Spp1KO/KO, AppNL-F and AppNL-F·Spp1KO/KO SLM. Scale bar represents 5 µm. h, Quantification of Homer1/Bassoon colocalization density normalized to WT or Spp1KO/KO accordingly. One datapoint represents the average of one animal (3–5 ROIs per animal) with a total of n = 4 animals per genotype. P < 0.0066 (WT) and 0.0831 (Spp1KO/KO) from two-way ANOVA, Bonferroni’s multiple comparison test. Data are shown as mean ± s.e.m.

