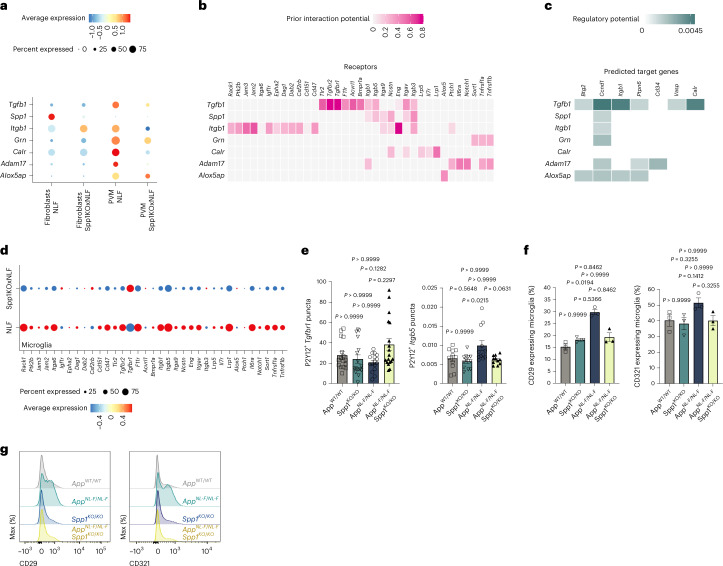
Fig. 5. Spp1 regulates perivascular–microglial interaction networks.
a, Expression level of selected ligands expressed by cell types known to express Spp1 (PVF and PVM), by cell type and genotype. Radius of dot is proportional to the percentage of cells expressing the gene; color is the scaled gene expression level. b, Predicted receptor genes for ligands represented in a, which show differential expression in microglia (receiver cells). Color represents the predicted interaction potential. c, Predicted target genes downstream of receptors identified in b, which show differential expression in microglia (receiver cells). Color represents the predicted regulatory potential. d, Expression of predicted receptor genes in microglia, by genotype. Radius of dot is proportional to the percentage of cells expressing the gene; color is the scaled gene expression level. e, Quantification of Tgfbr1 and Itgb5 mRNA levels expressed by P2Y12+ microglia assessed by smFISH-IHC in 6-month WT, Spp1KO/KO, AppNL-F and AppNL-F·Spp1KO/KO SLM. One datapoint represents one individual P2Y12+ microglia with a total of 11 (WT, AppNL-F·Spp1KO/KO) and 12 (Spp1KO/KO, AppNL-F) microglia (Itgb5) or 16 (WT, AppNL-F), 17 (Spp1KO/KO) and 18 (AppNL-F·Spp1KO/KO) microglia (Tgfbr1) pooled from n = 3 animals per genotype examined over one independent experiment. P values from one-way ANOVA, Kruskal–Wallis test with Dunn’s multiple comparisons test. f, Quantification of NicheNet hits CD29 (Itgb1) and CD321 (F11r) on microglia (CX3CR1highCD45+CD11b+ CD206-) isolated from hippocampal homogenates of 6-month WT, Spp1KO/KO, AppNL-F and AppNL-F·Spp1KO/KO animals. One datapoint represents one individual mouse (microglia) pooled from n = 3 mice from one experiment. P values from one-way ANOVA, Kruskal–Wallis test with Dunn’s multiple comparisons test. g, Flow cytometry profiles of the protein expression intensity of CD29 and CD321 on microglia of the four genotypes. Data are shown as mean ± s.e.m. See also Extended Data Fig. 6 and Supplementary Table 2.

