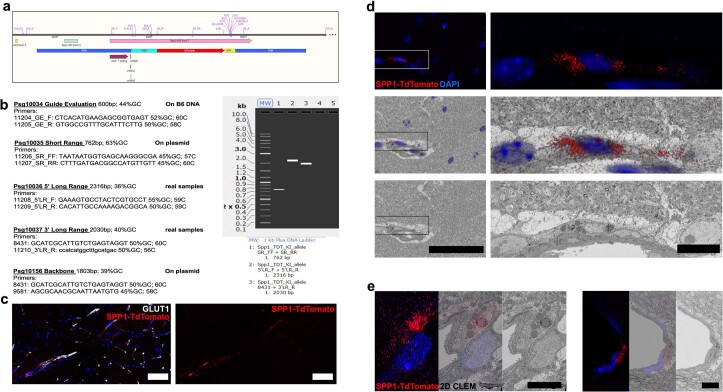
Extended Data Fig. 3. Spp1TdT reporter mouse development.
(a) Design of the knock-in allele is shown, with an IRES and TdTomato (TdT) reporter inserted at the stop codon in exon 7 in the mouse Spp1 locus. Top, the mouse locus with locations of primers used for validation of the inserted construct and later genotyping for the reporter construct is shown. Below, schematic displays the upstream (5’HA) and downstream (3’HA) homology arms in blue; IRES in aqua; TdT reporter gene in red; and bovine growth hormone poly(A) region in yellow. (b) PCR primers used to confirm incorporation of construct are listed, with primer names based on genomic locations as shown in B. Gel shows appropriate size bands for incorporation of plasmid construct (lane 1), for left arm integration event (lane 2) and right arm integration event (lane 3). Primer pairs for plasmid backbone alone are negative (lanes 4 and 5). (c) Representative confocal image showing SPP1-TdT expression along GLUT1+ vessels in hippocampus of 3 mo Spp1TdT reporter mice. (d) Left panels show low magnification overview of SPP1-TdT+ cell (red), and all nuclei (blue) in the hippocampus, as shown in Fig. 2h, scale bar 50 µm. Top, maximum intensity projection of confocal stack; middle, maximum intensity projection shown at reduced opacity over the correlated back scattered electron image of serial section 79 of the same region of the CLEM sample; bottom, back scattered electron image of serial section 79 of the same region of the CLEM sample alone. Box highlights region acquired across 200 serial sections. Right panels show boxed region at higher magnification with serial section 85. Scale bar represents 10 µm. Data representative of n = 4 Spp1TdT mice examined over 2 independent experiments. (e) Two additional CLEM examples of SPP1-TdT+ cells targeted and correlated with volume electron microscopy. Left panels show maximum intensity projection of confocal stack; middle panels, maximum intensity projection shown at reduced opacity over the correlated back scattered electron image of a central serial section of the same region of the CLEM sample; right panels, back scattered electron image of the same region of the CLEM sample alone. Scale bar represent 5 µm. Data representative of n = 4 Spp1TdT mice examined over 2 independent experiments.

