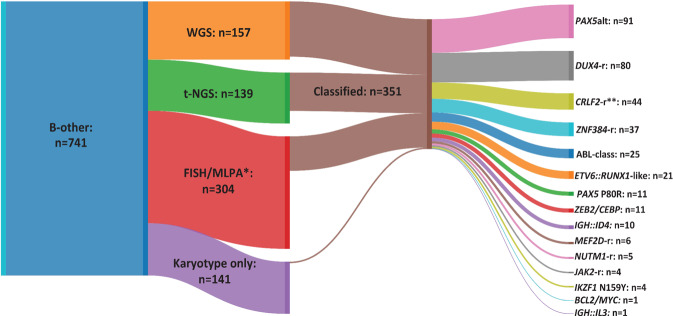
Fig. 1. Classification of B-other-ALL cohort according to technique.
Sankey plot showing the number of patients tested by each technique and those classified into genomic subtypes of B-other-ALL, as defined in Table 1. *Cases tested by FISH and/or MLPA, not all cases by all kits and probes. **Excludes 9 patients with other subtype defining abnormalities. WGS Whole genome sequencing, t-NGS Targeted next generation sequencing, FISH Fluorescence in situ hybridisation, MLPA Multiplex Ligation-dependent Probe Amplification.

