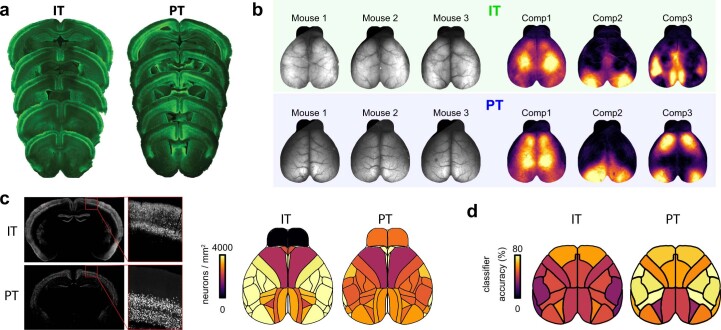
Extended Data Fig. 2. Cortex-wide expression patterns of PT and IT neurons.
(a) Brain slices from IT and PT neurons show robust cortex-wide expression of GCaMP6. (b) Left: Raw fluorescence from widefield imaging of 3 different PT and IT mice. In both lines, we obtained strong fluorescence throughout the cortex, although minor fluctuations in brightness were visible across regions. Right: Example sNMF components from an individual PT/IT mouse (mouse #3 for both lines). sNMF components did not strongly reflect differences in raw fluorescence across cortex. We also observed no clear relationship between fluorescence patterns to total variance (Fig. 1D) or ongoing activity patterns (Supplementary. Movies 2, 3). (c) Left: Example brain slices from IT- and PT-Cre mice to quantify the density of Cre-expressing neurons in each line. Blow-up shows a magnified region in cortex with individual somata. Right: Expression density was largely even across dorsal cortex with higher density of IT neurons in lateral regions and no expression in the olfactory bulb. Density was slightly reduced in M2 for both lines. (d) Map of PyN type decoding accuracy with locaNMF components for different cortical regions. Decoding accuracy was high across cortical regions and we found no clear relation between expression patterns and regions with particularly high locaNMF decoding accuracy. Olfactory bulb was omitted from the analysis, due to the lack of strong fluorescence signals.

