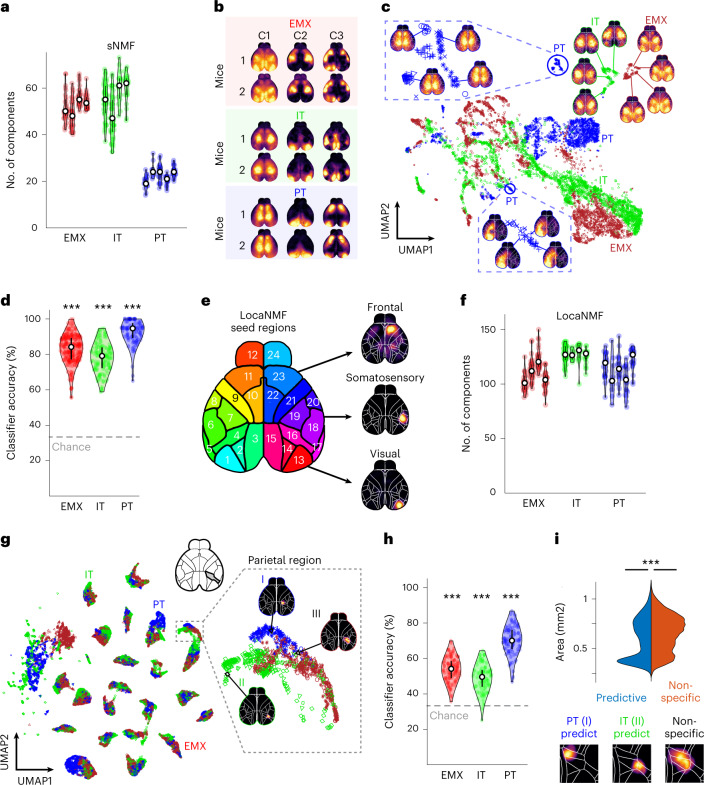
Fig. 2. Pyramidal neuron types exhibit unique cortical activity patterns.
a, Number of sNMF components, accounting for 99% of variance per PyN type. Violin plots show individual mice; dots indicate individual sessions. b, Spatial sNMF components from different mice of the same PyN type (colored rectangles) strongly resembled each other. c, UMAP embedding of spatial sNMF components for EMX (red), IT (green) and PT (blue) mice. Maps show spatial components at different UMAP locations. Marker types denote individual mice. Blown-up areas show examples of PT-specific regions. d, Accuracy of a PyN-type classifier. Data points represent the mean classification accuracy per session. Asterisks represent Bonferroni-corrected P < 10−10 against 33% chance (two-sided t-test, nEMX = 124 sessions; nIT = 133, nPT = 93 sessions). e, Map of seed regions used for LocaNMF analysis. f, Number of LocaNMF components, accounting for 99% of variance per PyN type. Conventions as in a. g, UMAP projection embedding of spatial LocaNMF components. Conventions as in c. The UMAP shows clustering of LocaNMF components from similar regions (same 24 regions as in e). Components within individual regions are further divided for different PyN types. Maps show example LocaNMF components (I–III). h, Accuracy of a PyN type classifier, based on individual LocaNMF components. Conventions as in d. Asterisks denote Bonferroni-corrected P < 10−10 against 33% chance (two-sided t-test, nEMX = 124 sessions; nIT = 133, nPT = 93 sessions). i, Peak normalized distributions of area size for PyN-type-predictive (blue) versus nonspecific (red) LocaNMF components. PyN-predictive components are smaller than nonspecific components (PyN-predictive: median = 0.59 mm2, n = 6,317 components; nonspecific: median = 0.68mm2, n = 18,938 components; two-sided rank-sum test: P < 10−10). Examples of PyN-predictive (I and II) and nonspecific (III) components in right parietal cortex.

