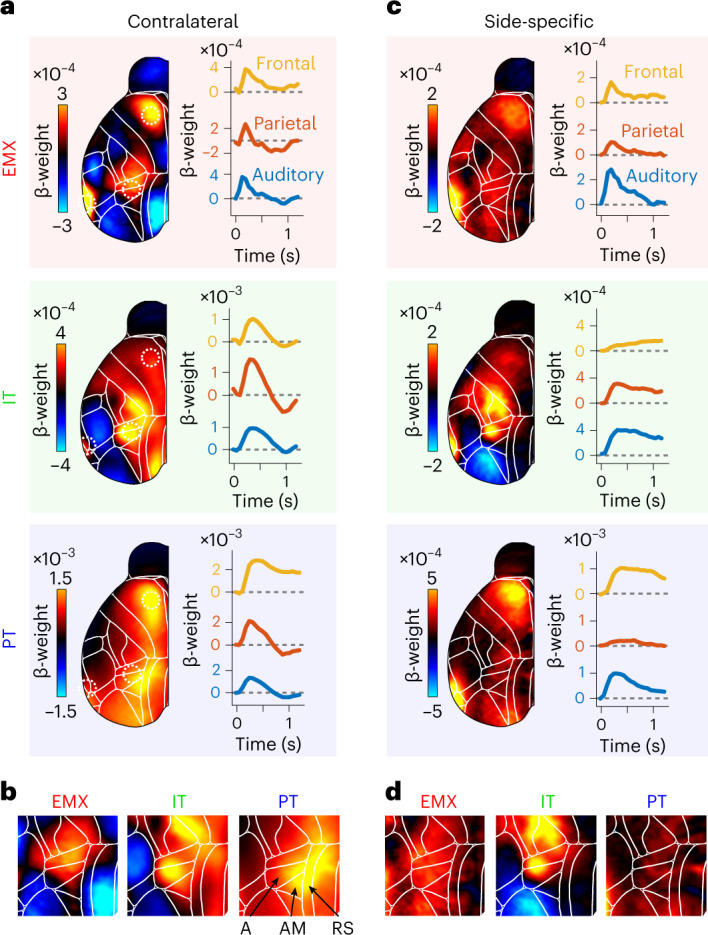
Fig. 5. Pyramidal neuron-specific differences are evident in the location and specificity of cortical stimulus responses.

a, Left, response kernels for contralateral stimuli in EMX (red), IT (green) and PT neurons (blue), averaged between 0 and 200 ms across all mice per group. Right, stimulus-evoked activity in auditory (blue), parietal (red) and frontal cortices (yellow). Dashed circles on the left show cortical locations. b, Magnified view of parietal cortex for stimulus maps in a. PyNs differed in the location of sensory responses. Arrows show location of parietal areas A, AM and retrosplenial cortex (RS; Allen Brain Atlas, CCF v3)31. c, Side-specific stimulus responses, computed as the difference between contralateral and ipsilateral stimulus kernels. Hot colors denote stronger contra-response. Conventions as in a. d, Magnified view of parietal cortex for side-specific maps in c. IT neurons show clear, side-specific parietal responses that were weaker in EMX and absent for PT neurons.
